
K-Means
- Rows
- Every row gets a cluster.
- Center
- A mean centroid.
- Distance
- Euclidean.
- Complexity
- O(n·k·d·i)
Loading…
A centroid is the mean of the rows in its cluster, so the center can sit between customers. DBSCAN does not place a centroid, and it can leave a row as noise instead of forcing that row into a cluster.
Choose whether every row has to join a cluster.
This is a choice, not a measured winner.
DBSCAN Clustering has the higher silhouette on Iris Flowers and Customer Segments; DBSCAN Clustering has no silhouette on Wine (UCI wine recognition), because that fit did not keep two groups; Noise rows show up on Iris Flowers and Wine (UCI wine recognition).
Can a sparse row stay noise?
A row that does not have to join a cluster.
Wholesale Customers has 440 rows and six spend columns: Fresh, Milk, Grocery, Frozen, Detergents_Paper, and Delicassen. Channel and Region stay out of the fit.
K-Means has 3 clusters. Silhouette 0.548287. Calinski–Harabasz 140.135183. Davies–Bouldin 0.927935. Inertia 1608.431149. Adjusted Rand —.
DBSCAN has 1 cluster. Silhouette —. Calinski–Harabasz —. Davies–Bouldin —. Adjusted Rand —. Noise 32.
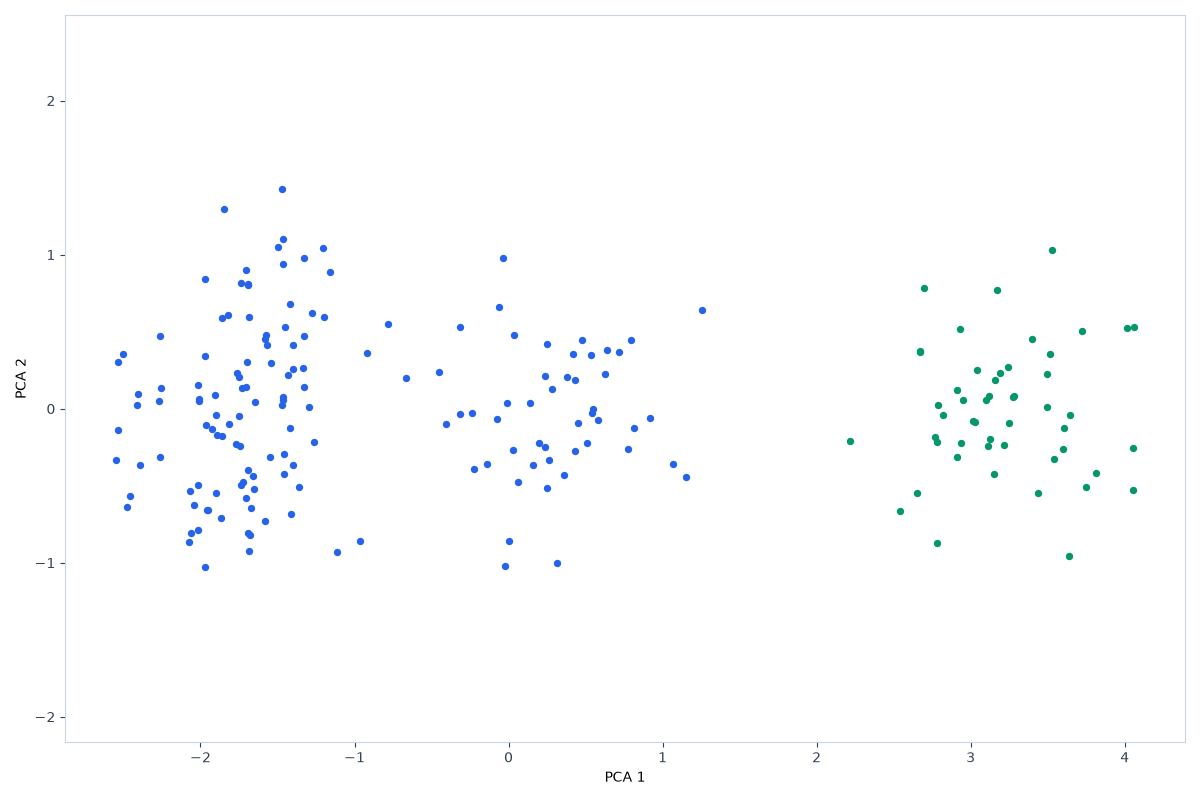
On the PCA plot, most customers sit in a dense group and a few sit far out on the tail.
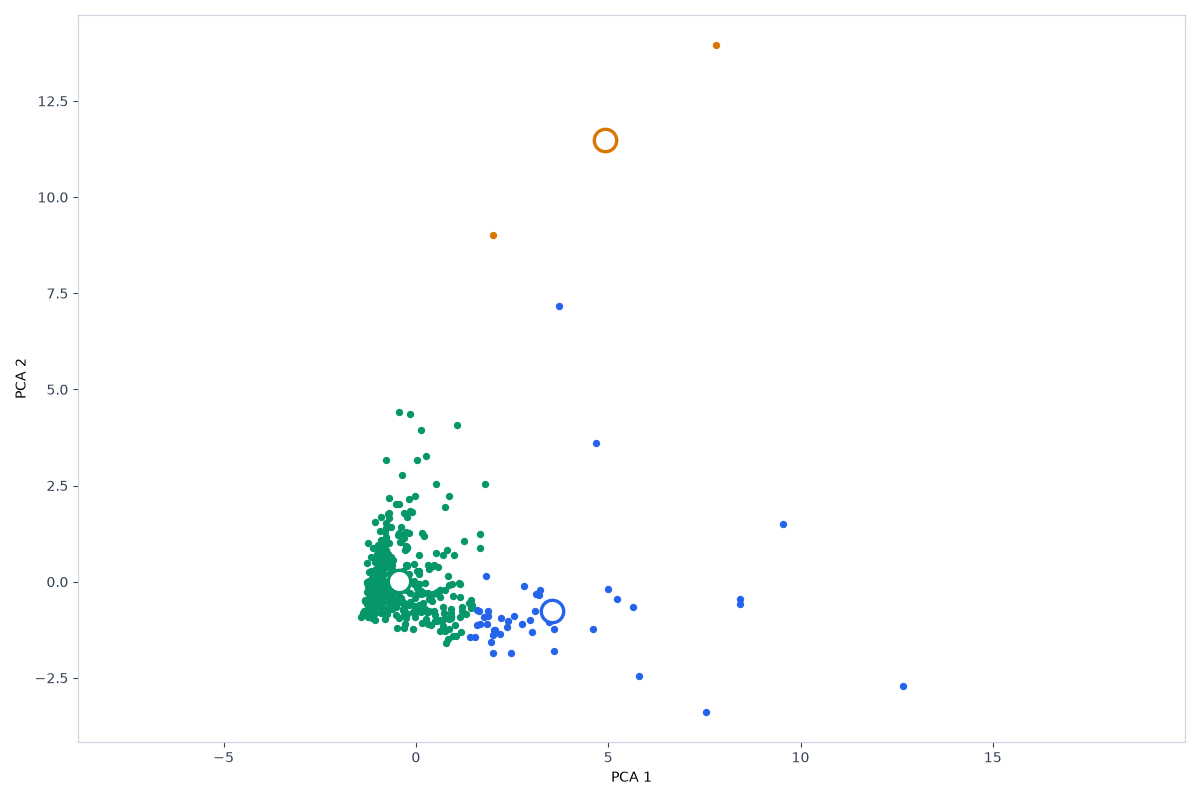
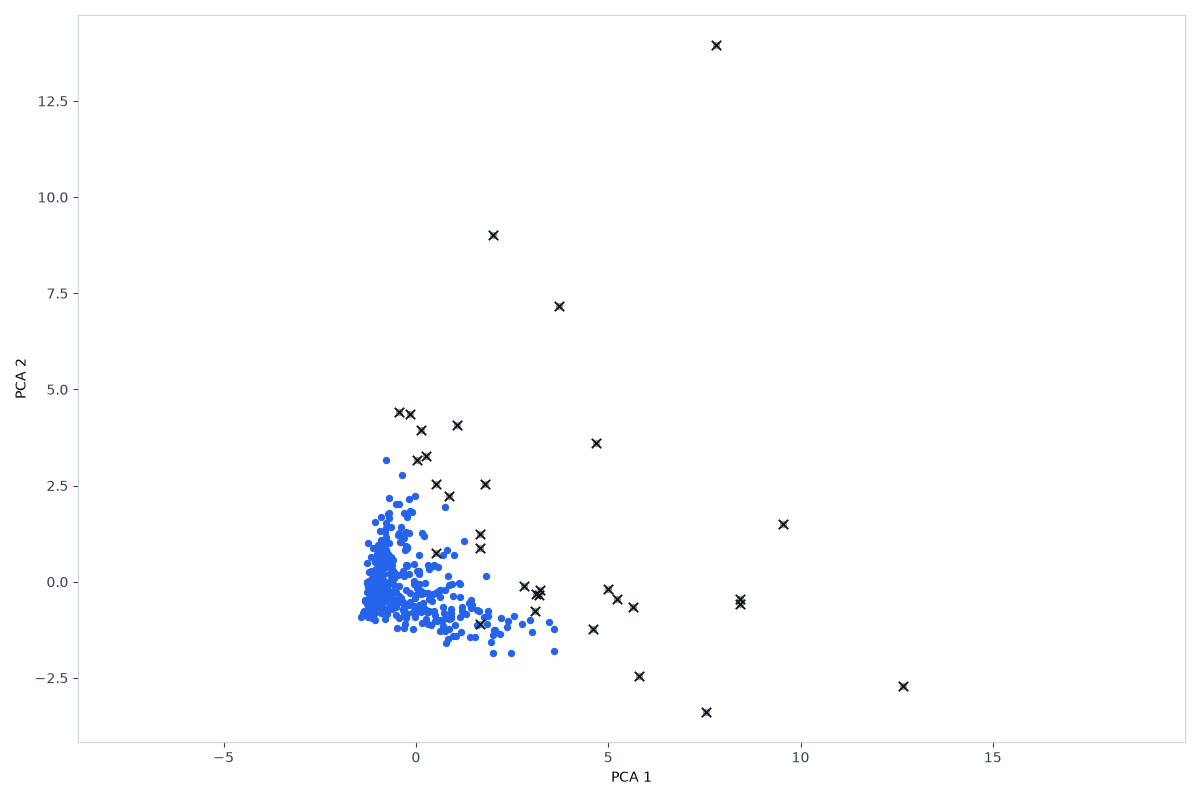
The six spend columns are right-skewed, so a mean can be pulled by the tail, while DBSCAN marks 32 rows as noise on that high-spend tail and keeps one dense region, so its silhouette is not defined (K-Means silhouette 0.548287).
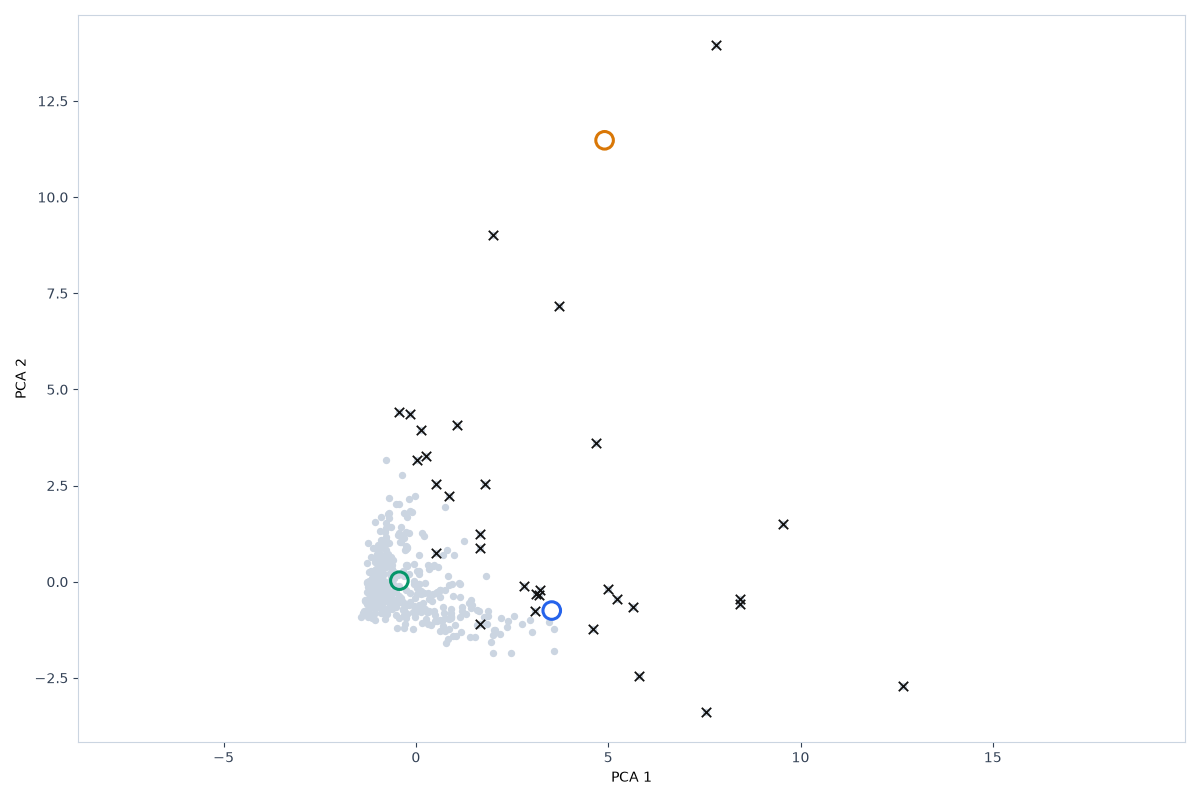
The link loads the six-column sample. K-Means is set to k=3. DBSCAN is set to eps 1.335645 and min_samples 5. Run is still required.
from sklearn.cluster import KMeans
from sklearn.preprocessing import StandardScaler
Xs = StandardScaler().fit_transform(X)
labels = KMeans(n_clusters=3, n_init=10, random_state=42).fit_predict(Xs)
from sklearn.cluster import DBSCAN
from sklearn.preprocessing import StandardScaler
Xs = StandardScaler().fit_transform(X)
labels = DBSCAN(eps=1.335645, min_samples=5).fit_predict(Xs)
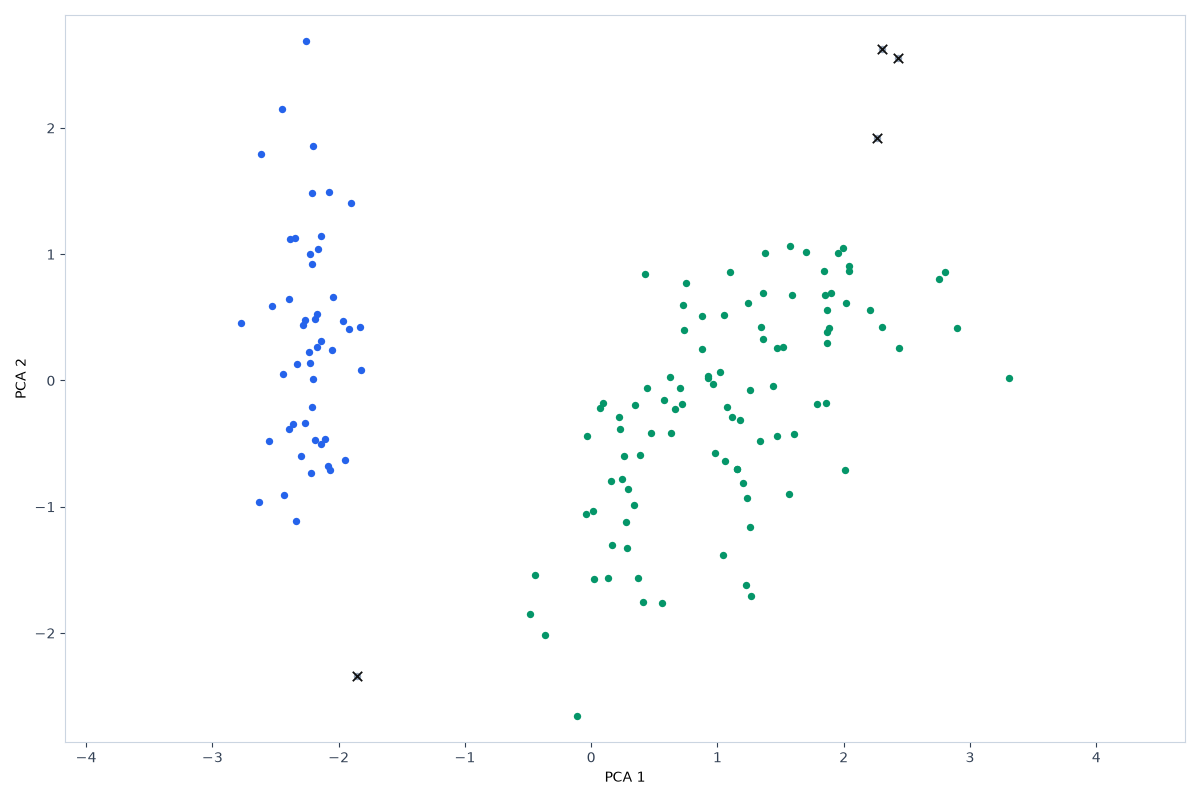
On Iris Flowers (150 rows and 4 features), K-Means keeps 3 groups and 0 noise rows, with silhouette 0.460, Calinski-Harabasz 241.904, and adjusted Rand 0.620. DBSCAN keeps 2 dense regions and 4 noise rows, with silhouette 0.598, Calinski-Harabasz 277.651, and adjusted Rand 0.552. The density grouping is the cleaner separation on this table.
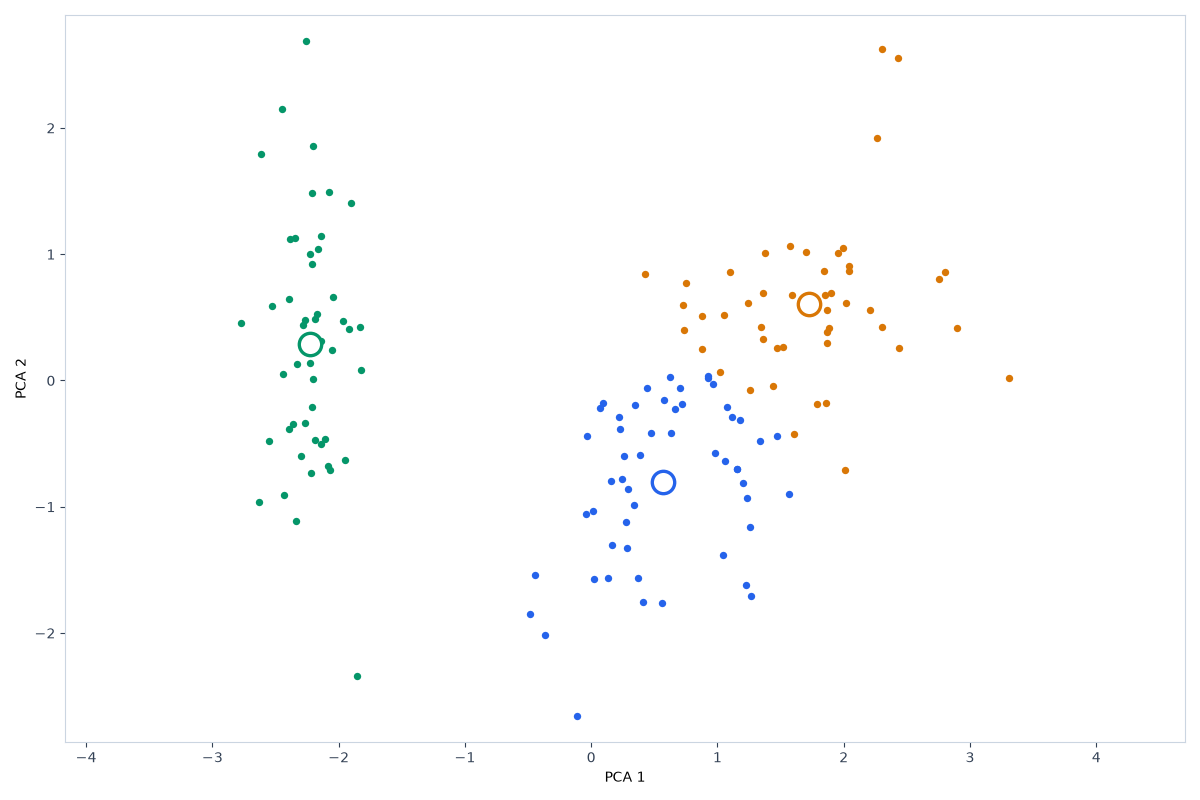
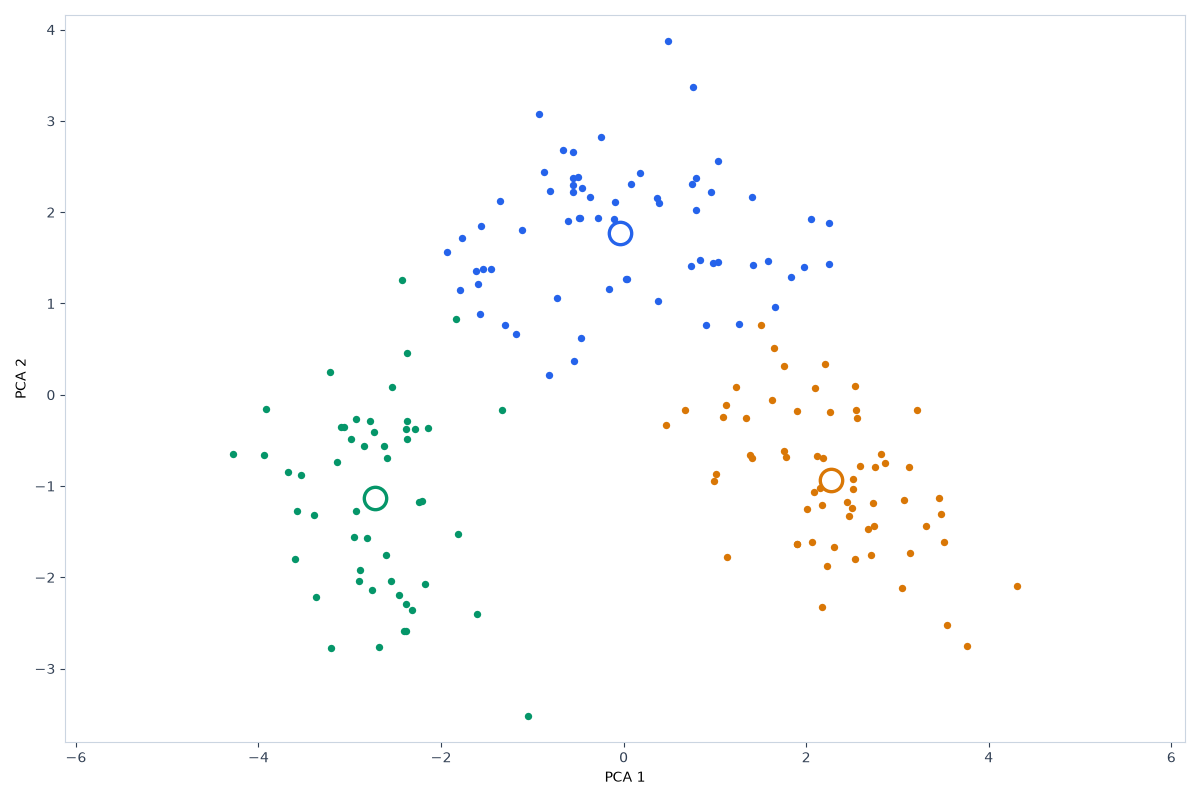
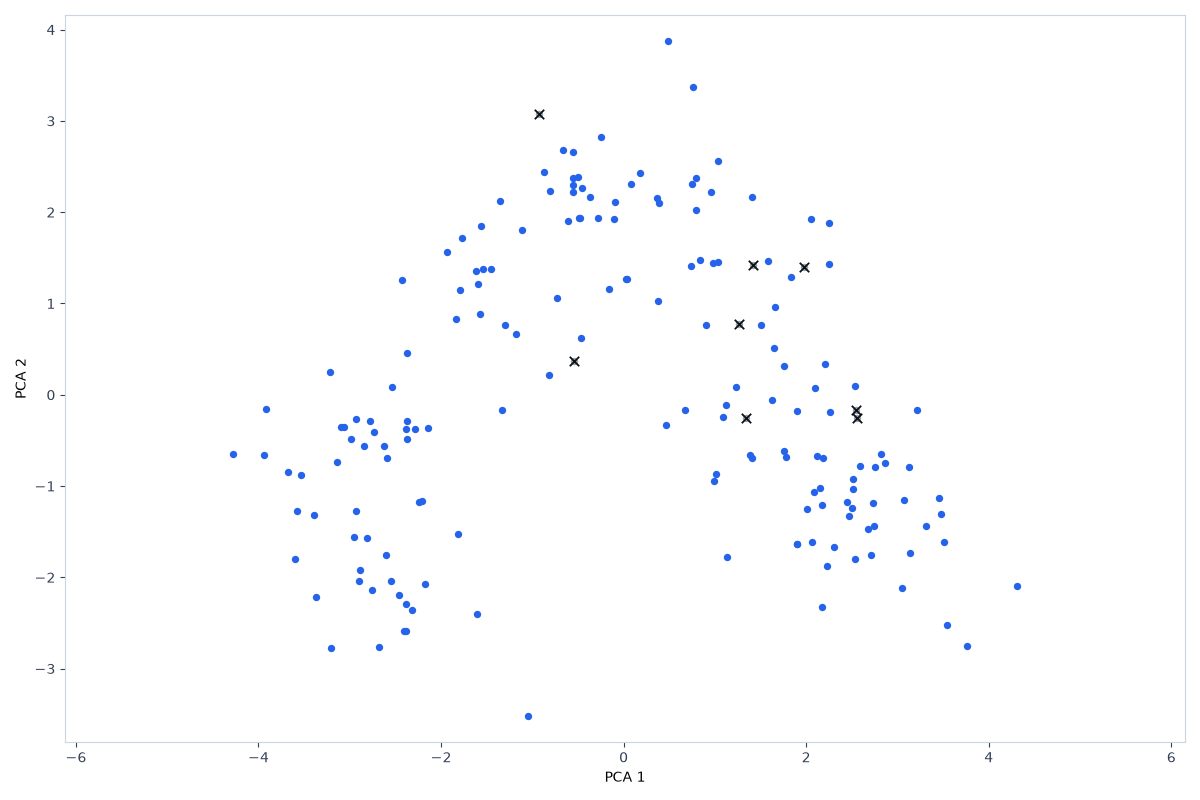
On Wine (UCI wine recognition) (178 rows and 13 features), K-Means keeps 3 groups and 0 noise rows, with silhouette 0.285, Calinski-Harabasz 70.940, and adjusted Rand 0.897. DBSCAN keeps 1 dense regions and 8 noise rows, with silhouette not defined, Calinski-Harabasz not defined, and adjusted Rand not defined. DBSCAN silhouette is not defined, because that density fit did not leave two or more dense regions.
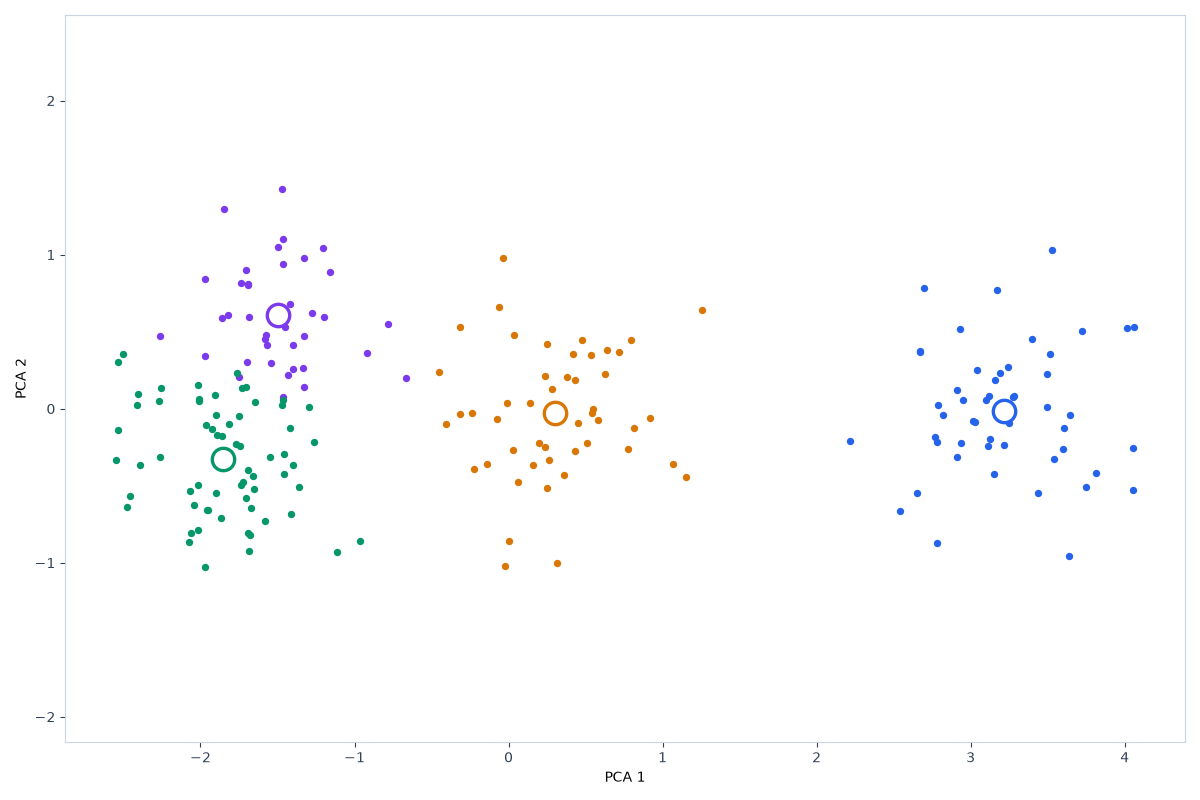
On Customer Segments (200 rows and 5 features), K-Means keeps 4 groups and 0 noise rows, with silhouette 0.368, Calinski-Harabasz 373.794, and adjusted Rand 0.763. DBSCAN keeps 2 dense regions and 0 noise rows, with silhouette 0.608, Calinski-Harabasz 441.900, and adjusted Rand 0.330. The density grouping is the cleaner separation on this table.
| Dataset | Algorithm | Clusters | Noise | Silhouette | Adjusted Rand |
|---|---|---|---|---|---|
| Wholesale Customers | K-Means | 3 | 0 | 0.548 | — |
| Wholesale Customers | DBSCAN | 1 | 32 | — | — |
| Iris Flowers | K-Means Clustering | 3 | 0 | 0.460 | 0.620 |
| Iris Flowers | DBSCAN Clustering | 2 | 4 | 0.598 | 0.552 |
| Wine (UCI wine recognition) | K-Means Clustering | 3 | 0 | 0.285 | 0.897 |
| Wine (UCI wine recognition) | DBSCAN Clustering | 1 | 8 | not defined | not defined |
| Customer Segments | K-Means Clustering | 4 | 0 | 0.368 | 0.763 |
| Customer Segments | DBSCAN Clustering | 2 | 0 | 0.608 | 0.330 |
A centroid is the mean of the rows in its cluster, so the center can sit between customers. DBSCAN does not place a centroid, and it can leave a row as noise instead of forcing that row into a cluster.
This is a choice, not a measured winner.
The six spend columns are right-skewed, so a mean can be pulled by the tail, while DBSCAN marks 32 rows as noise on that high-spend tail and keeps one dense region, so its silhouette is not defined (K-Means silhouette 0.548287).
Method: StandardScaler, drop constant columns. Code version 3e4afc4b4352 (scripts/seo/build_explore_artifacts.py). scikit-learn 1.4.2. Seed 42. Both algorithms were fit on the same scaled table. Where a label column exists, it was held out of the fit and scored with adjusted Rand. Iris Flowers: UCI Machine Learning Repository, Iris (Fisher, 1936). License: CC BY 4.0. Wine (UCI wine recognition): UCI Machine Learning Repository, wine recognition. License: CC BY 4.0. Customer Segments: Synthetic customer records bundled with this site. License: Generated for demos; no external license.
Results computed, published, and last updated on 2026-11-02.
The comparison sentences are filled from these published runs by a fixed template, so the scores can be checked against the same datasets in the tool.
Maintainer: nikolaou1982.
Contact: nick1982100@gmail.com.