
K-Means
- Center
- A mean centroid.
- Distance
- Euclidean. That is the published fit and the dashboard default.
- Outliers
- The Outlier Detection card starts off. It scores distance to the centroid.
- Scale
- Standard (Z-score).
- Complexity
- O(n·k·d·i)
Loading…
A centroid is the mean of the rows in its cluster, so it can fall between customers. A medoid is one of those rows, so the center is a customer who is actually in the table.
Choose the center you want.
K-Means Clustering has the higher silhouette on Wine (UCI wine recognition); K-Medoids Clustering has the higher silhouette on Customer Segments; Silhouette is within 0.01 on Iris Flowers.
Need a real exemplar?
A center that is an actual row.
Path taken
Pick K-Medoids when the center has to be a real row, and read that row under Medoid Representatives.
Pick K-Means when a mean centroid is enough, including on a larger table, because 440 rows do not trip MiniBatch or the K-Medoids subsample notice.
440 rows. The fit uses Fresh, Milk, Grocery, Frozen, Detergents_Paper, and Delicassen. Channel and Region were held out of the fit.
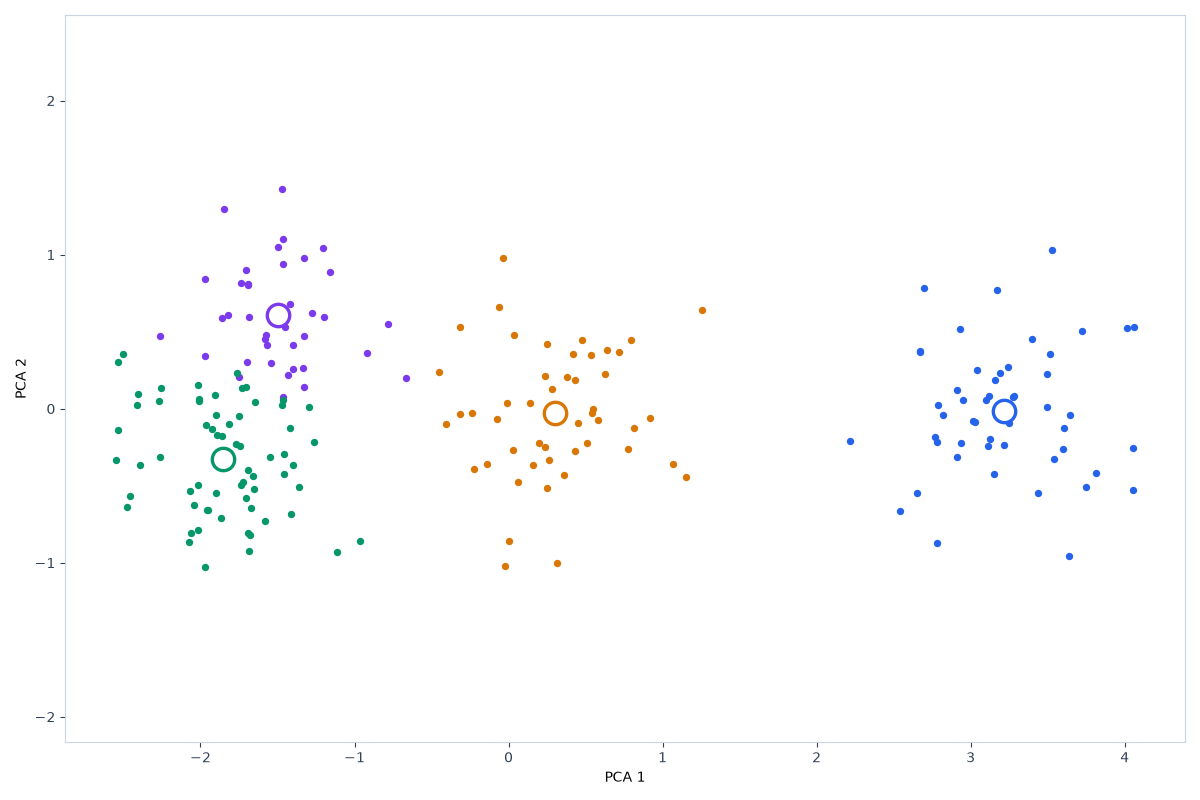
K-Means Clustering has 3 clusters. Silhouette 0.548287. Calinski–Harabasz 140.135183. Davies–Bouldin 0.927935. Inertia 1608.431149. Adjusted Rand —.
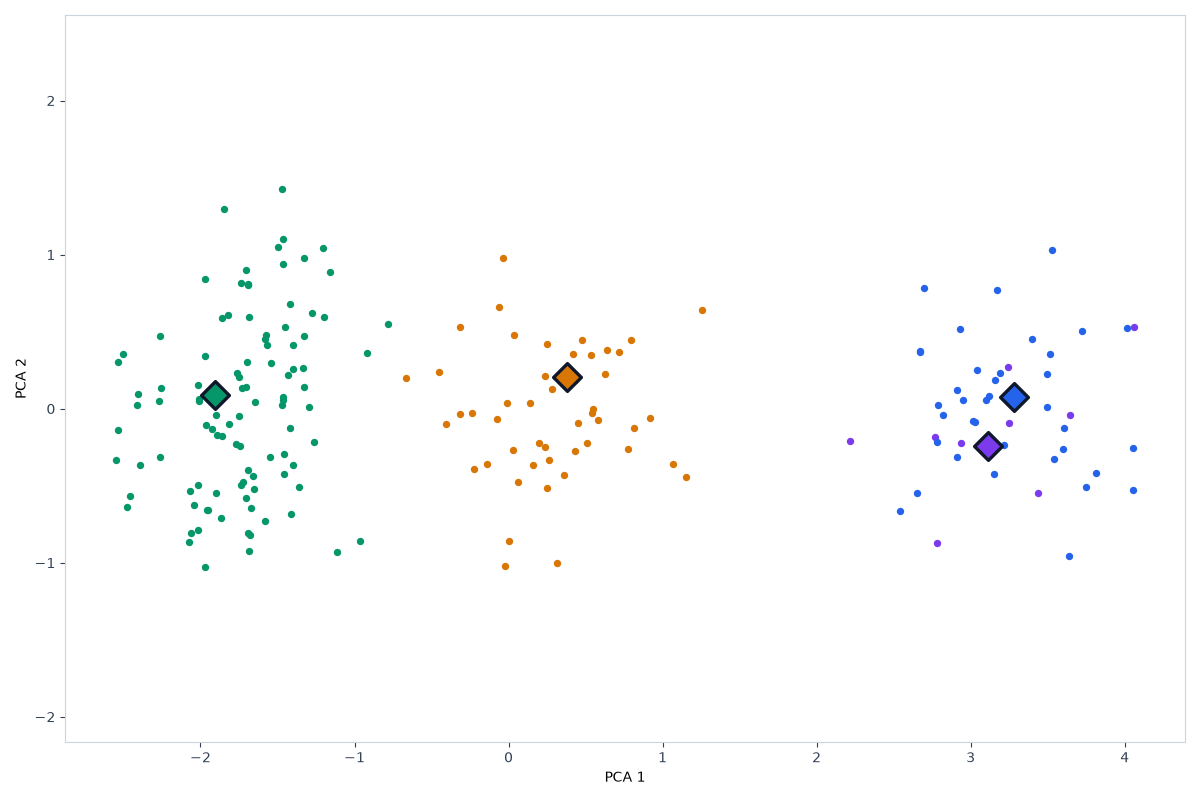
K-Medoids Clustering has 3 clusters. Silhouette 0.410786. Calinski–Harabasz 126.186957. Davies–Bouldin 1.087592. Inertia 633.297863. Adjusted Rand —.
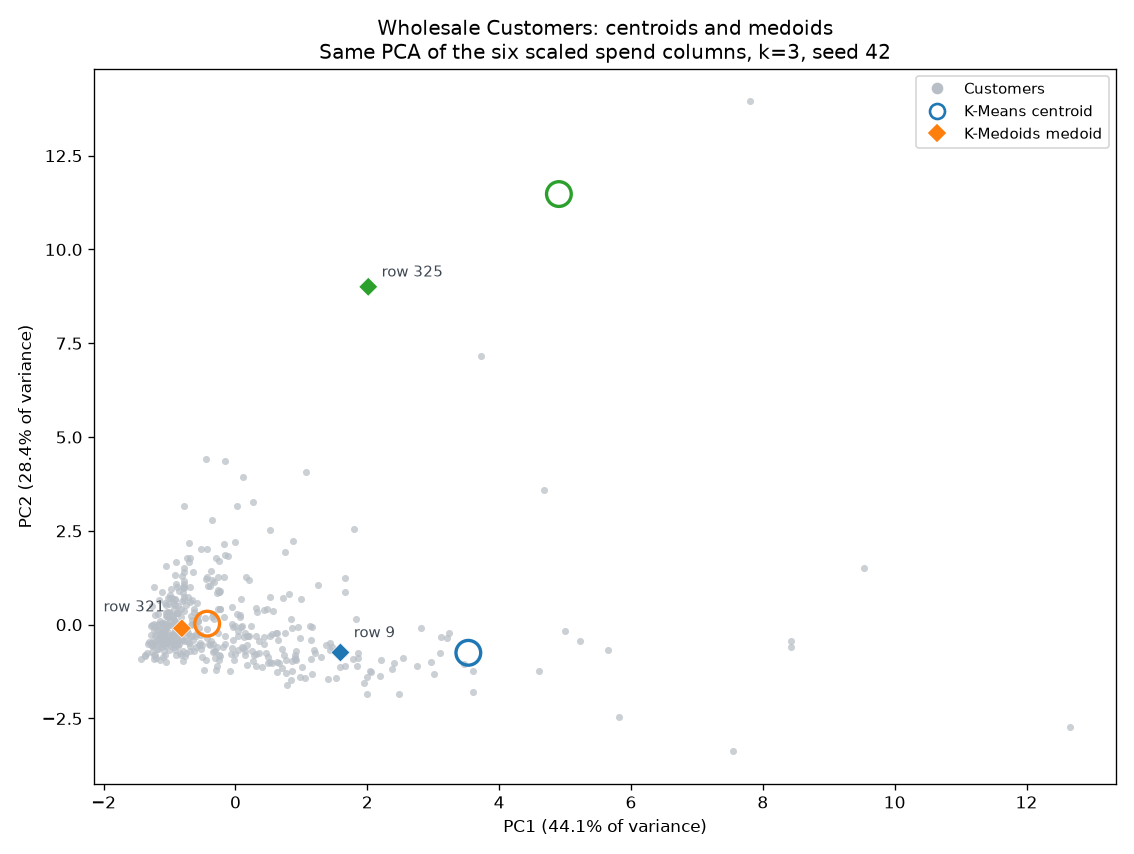
On the PCA plot, most customers sit in a dense group and a few sit far out on the tail.
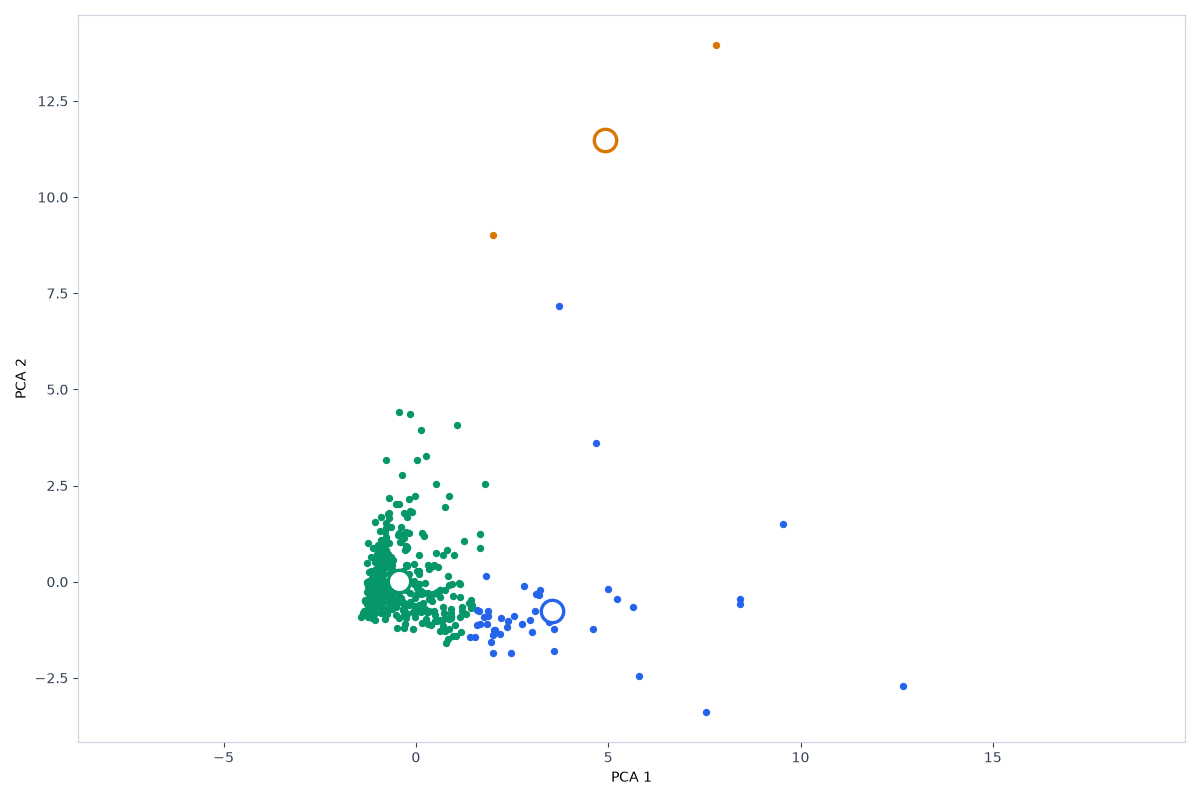
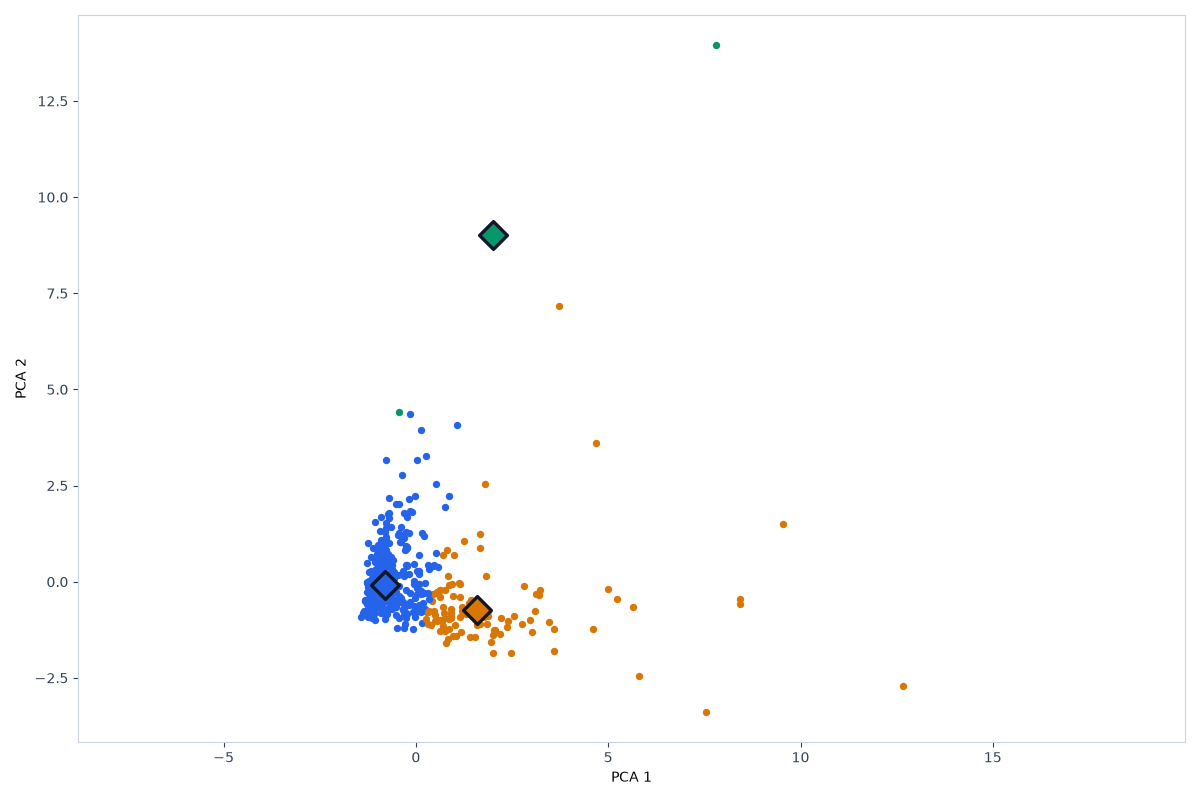
The six spend columns are right-skewed, so silhouette favors K-Means (0.548 vs 0.411) because it measures Euclidean variance, while each medoid is a real customer row.
Rows 321 and 9 sit 0.5 and 2.2 scaled units from the mean of the dense group, and row 325 sits 12.3 units out on the high-spend tail.
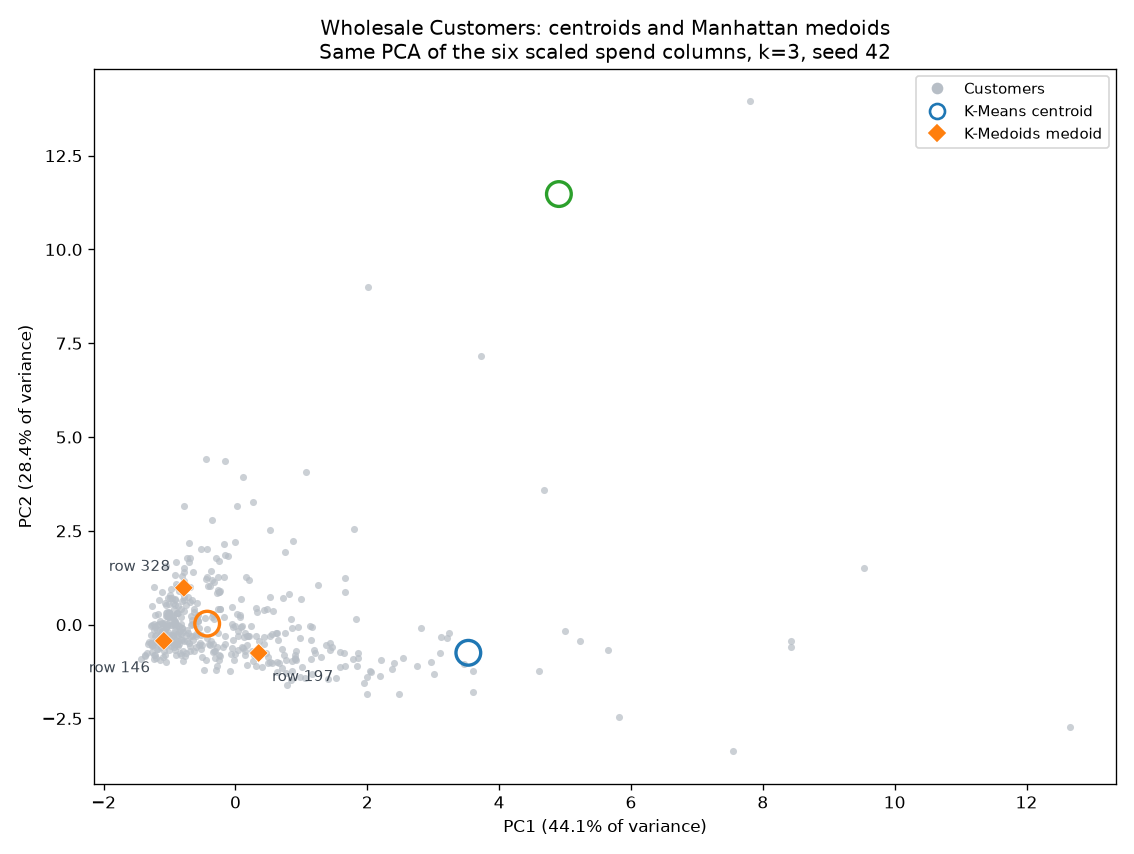
Rows 146, 197, and 328 sit 0.8 to 1.2 scaled units from the mean of the dense group, against a Euclidean medoid 12.3 units out on the high-spend tail, so the linear L1 penalty keeps the center on a real row closer to the typical buyers.
The K-Means analysis and the K-Medoids analysis show Silhouette and Inertia on the KPI cards after Run. On K-Medoids, Profiling → Medoid Representatives lists the actual customer rows. K-Sweep stays empty until Auto k-selection is turned on, because the link pins k=3.
The link loads the six-column sample and sets k to 3, and Run is still required. On arrival the K-Medoids selects are still Alternate (fast), Heuristic (deterministic), and Euclidean. This is the dashboard default, not the builder fit.
Auto k-selection on K-Means says “Auto-select optimal k using silhouette score.” Auto k-selection on K-Medoids says “Sweep silhouette, CH, and DB scores to pick k,” the sweep of silhouette, Calinski–Harabasz, and Davies–Bouldin. The K-Sweep tab fills only after that toggle, and there is no Elbow control.
The Update Method select offers “Alternate (fast)” and “PAM (exact).” The published scores are the builder’s Euclidean fit, not either select value.
K-Means scores outliers with “Distance-to-centroid scoring,” and K-Medoids scores them with “Distance-to-medoid scoring.” Both cards start off.
from sklearn.cluster import KMeans
from sklearn.preprocessing import StandardScaler
Xs = StandardScaler().fit_transform(X)
labels = KMeans(n_clusters=3, n_init=10, random_state=42).fit_predict(Xs)
from sklearn.preprocessing import StandardScaler
Xs = StandardScaler().fit_transform(X)
# PAM with k-medoids++ init, euclidean distance, random_state=42, n_clusters=3.
# The sandbox K-Medoids control uses the same seed and scaling.
PAM medoids on Iris Flowers (150 rows and 4 features) choose 3 real rows as centers, silhouette 0.451, adjusted Rand 0.676, noise rows 0. K-Means places 3 mean centroids, silhouette 0.460, adjusted Rand 0.620, noise rows 0. Medoids and mean centroids land within 0.01 silhouette.
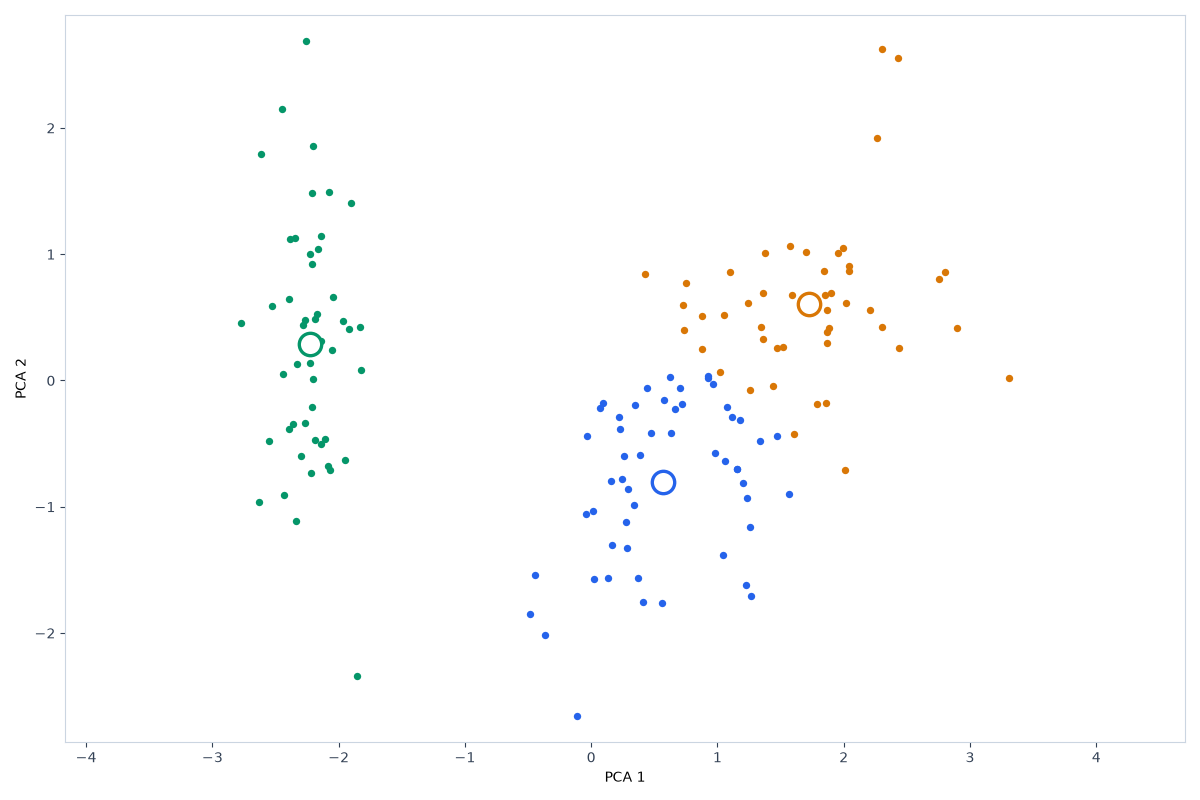
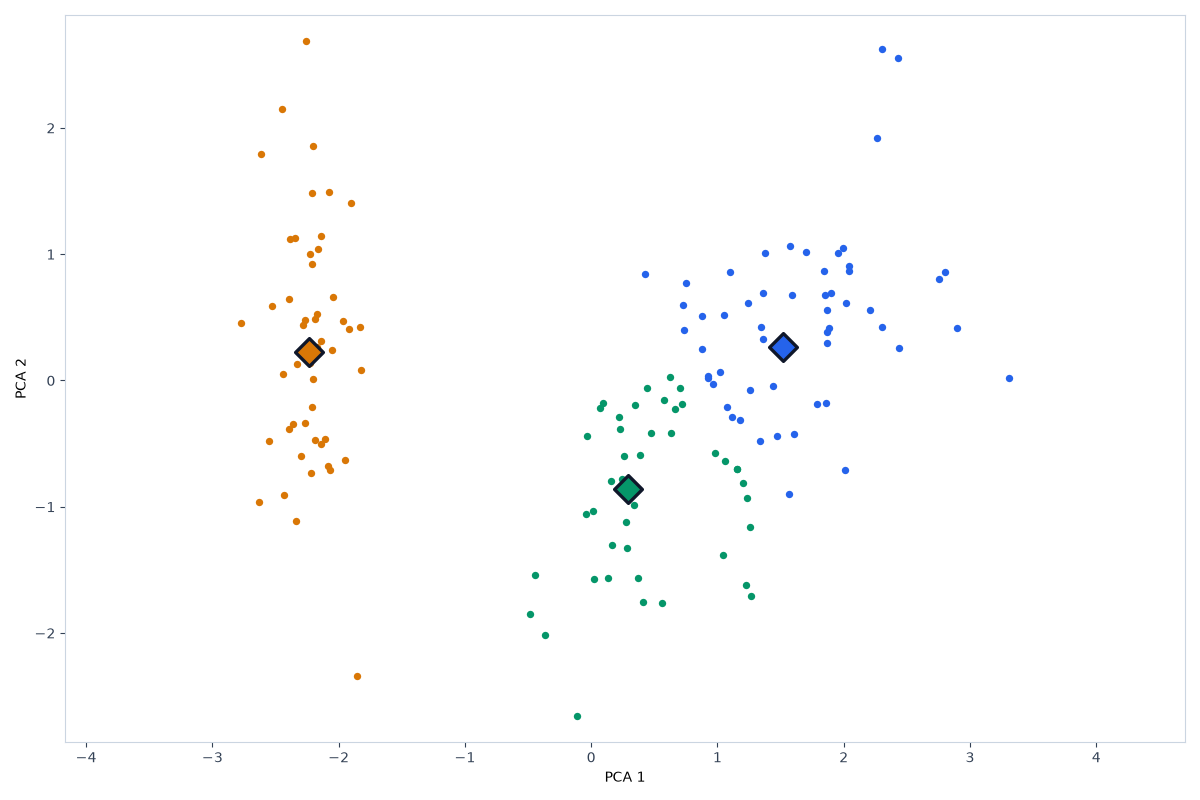
PAM medoids on Wine (UCI wine recognition) (178 rows and 13 features) choose 3 real rows as centers, silhouette 0.268, adjusted Rand 0.741, noise rows 0. K-Means places 3 mean centroids, silhouette 0.285, adjusted Rand 0.897, noise rows 0. Mean centroids separate this table more cleanly than the medoid rows.
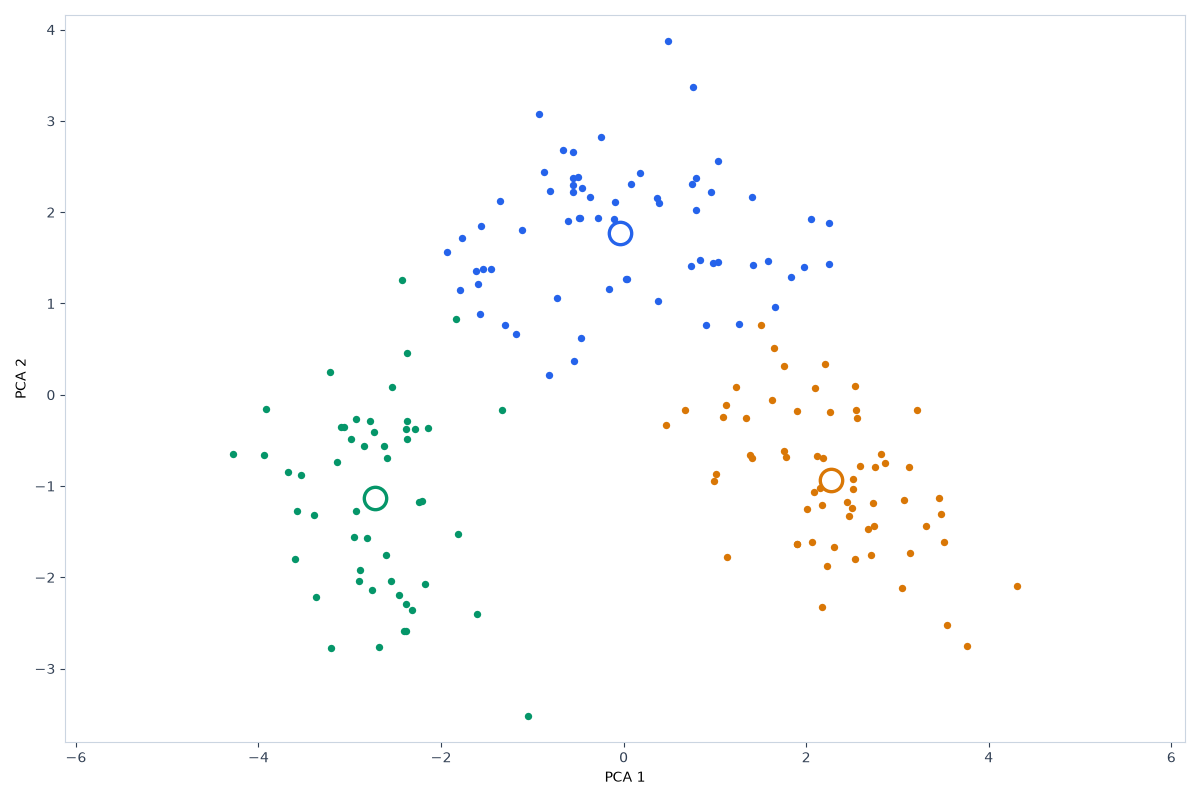
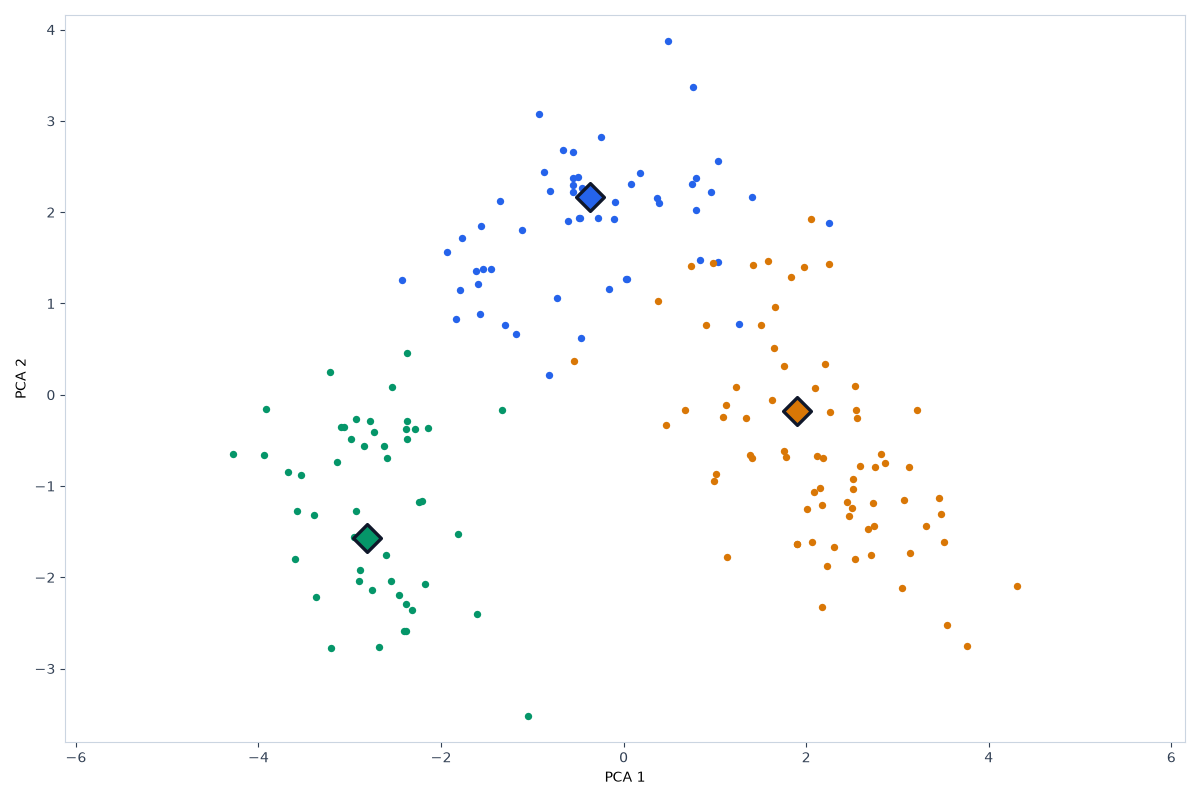
PAM medoids on Customer Segments (200 rows and 5 features) choose 4 real rows as centers, silhouette 0.397, adjusted Rand 0.640, noise rows 0. K-Means places 4 mean centroids, silhouette 0.368, adjusted Rand 0.763, noise rows 0. Medoid rows separate this table more cleanly than the mean centroids.
| Dataset | Algorithm | Clusters | Noise | Silhouette | Adjusted Rand |
|---|---|---|---|---|---|
| Wholesale Customers | K-Means Clustering | 3 | 0 | 0.548 | — |
| Wholesale Customers | K-Medoids Clustering | 3 | 0 | 0.411 | — |
| Iris Flowers | K-Means Clustering | 3 | 0 | 0.460 | 0.620 |
| Iris Flowers | K-Medoids Clustering | 3 | 0 | 0.451 | 0.676 |
| Wine (UCI wine recognition) | K-Means Clustering | 3 | 0 | 0.285 | 0.897 |
| Wine (UCI wine recognition) | K-Medoids Clustering | 3 | 0 | 0.268 | 0.741 |
| Customer Segments | K-Means Clustering | 4 | 0 | 0.368 | 0.763 |
| Customer Segments | K-Medoids Clustering | 4 | 0 | 0.397 | 0.640 |
A centroid versus a medoid is a mean versus an actual row, continued on a signed-in run under Medoid Representatives.
The published scores are Euclidean, and the K-Medoids Distance Metric select also offers Manhattan and Cosine, which this page did not measure.
This page's K-Means control has no distance select and its inertia is WCSS; the other distance lives on the K-Medoids select.
Method: StandardScaler, drop constant columns. Code version 3e4afc4b4352 (scripts/seo/build_explore_artifacts.py). scikit-learn 1.4.2. Seed 42. Both algorithms were fit on the same scaled table. Where a label column exists, it was held out of the fit and scored with adjusted Rand. Iris Flowers: UCI Machine Learning Repository, Iris (Fisher, 1936). License: CC BY 4.0. Wine (UCI wine recognition): UCI Machine Learning Repository, wine recognition. License: CC BY 4.0. Customer Segments: Synthetic customer records bundled with this site. License: Generated for demos; no external license.
Results computed, published, and last updated on 2026-11-02.
The comparison sentences are filled from these published runs by a fixed template, so the scores can be checked against the same datasets in the tool.
Maintainer: nikolaou1982.
Contact: nick1982100@gmail.com.