
K-Means
- Rows
- Hard assignment.
- Center
- A mean centroid.
- Distance
- Euclidean.
- Complexity
- O(n·k·d·i)
Loading…
A K-Means centroid is the mean of the rows assigned to it, so the center can sit between those customers. A full Gaussian mixture gives each row a probability across components, and each component has a mean and a covariance.
Choose whether a row gets one cluster or a probability across components.
This is a choice, not a measured winner.
K-Means Clustering has the higher silhouette on Iris Flowers; Gaussian Mixture Model (GMM) has the higher silhouette on Customer Segments; Silhouette is within 0.01 on Wine (UCI wine recognition).
Should a row keep a probability across components?
A soft assignment, instead of one cluster per row.
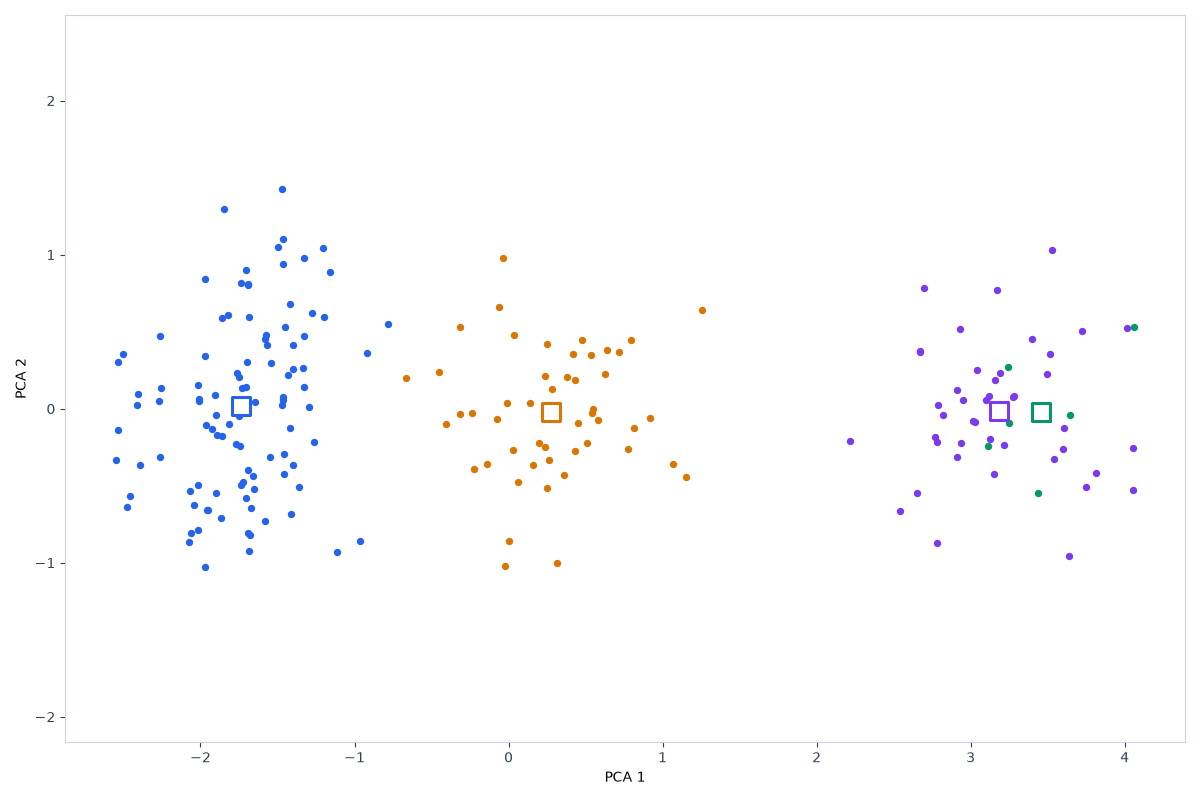
Wholesale Customers has 440 rows and six spend columns: Fresh, Milk, Grocery, Frozen, Detergents_Paper, and Delicassen. Channel and Region stay out of the fit.
K-Means has 3 clusters. Silhouette 0.548287. Calinski–Harabasz 140.135183. Davies–Bouldin 0.927935. Inertia 1608.431149. Adjusted Rand —.
Gaussian mixture has 3 components. Silhouette 0.21858. Calinski–Harabasz 68.080749. Davies–Bouldin 1.639242. Adjusted Rand —.
On the PCA plot, most customers sit in a dense group and a few sit far out on the tail.
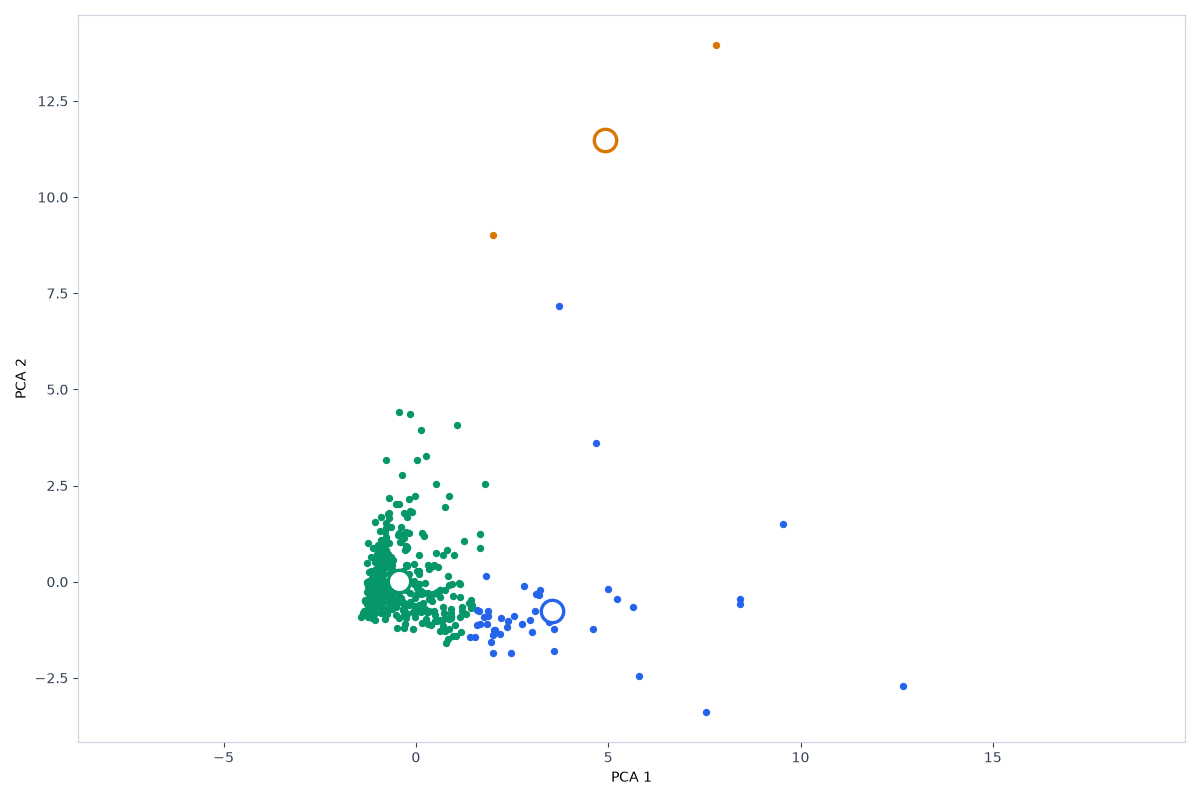
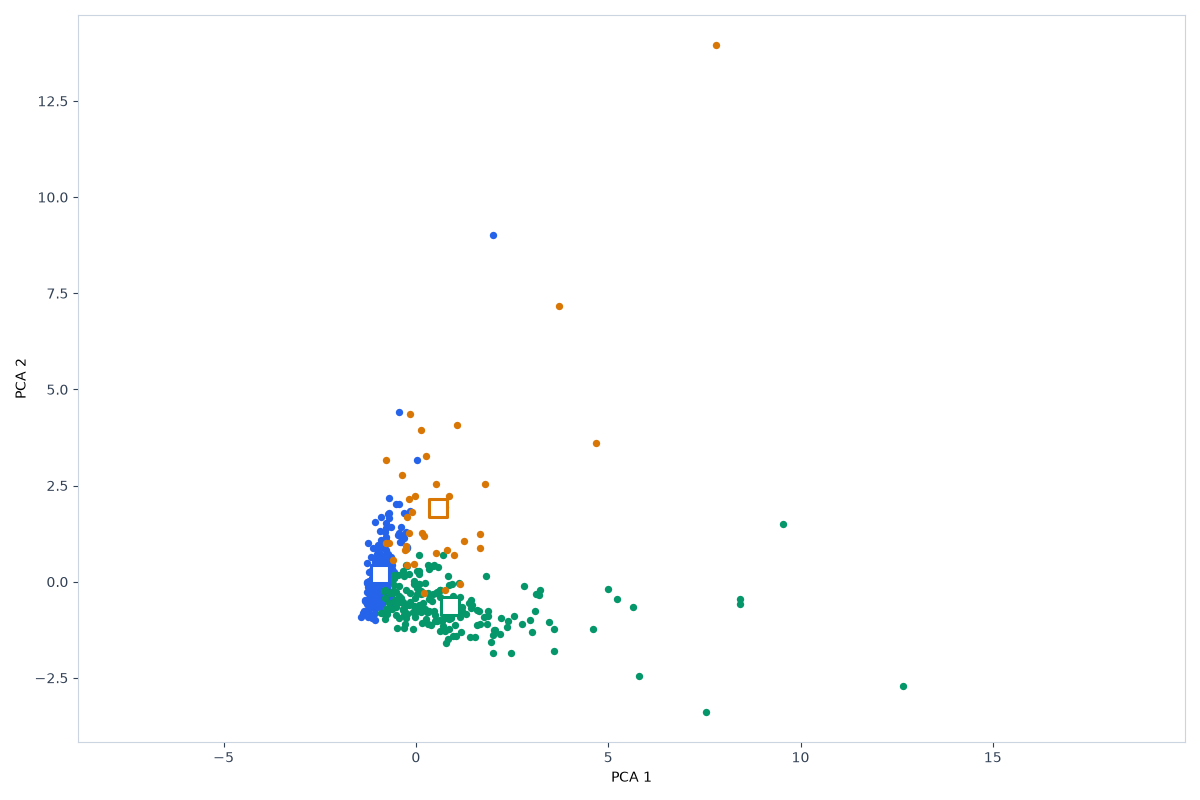
The six spend columns are right-skewed, so a mean can be pulled by the tail, while the Gaussian mixture uses 3 components with silhouette 0.21858 against K-Means silhouette 0.548287 on 3 clusters.
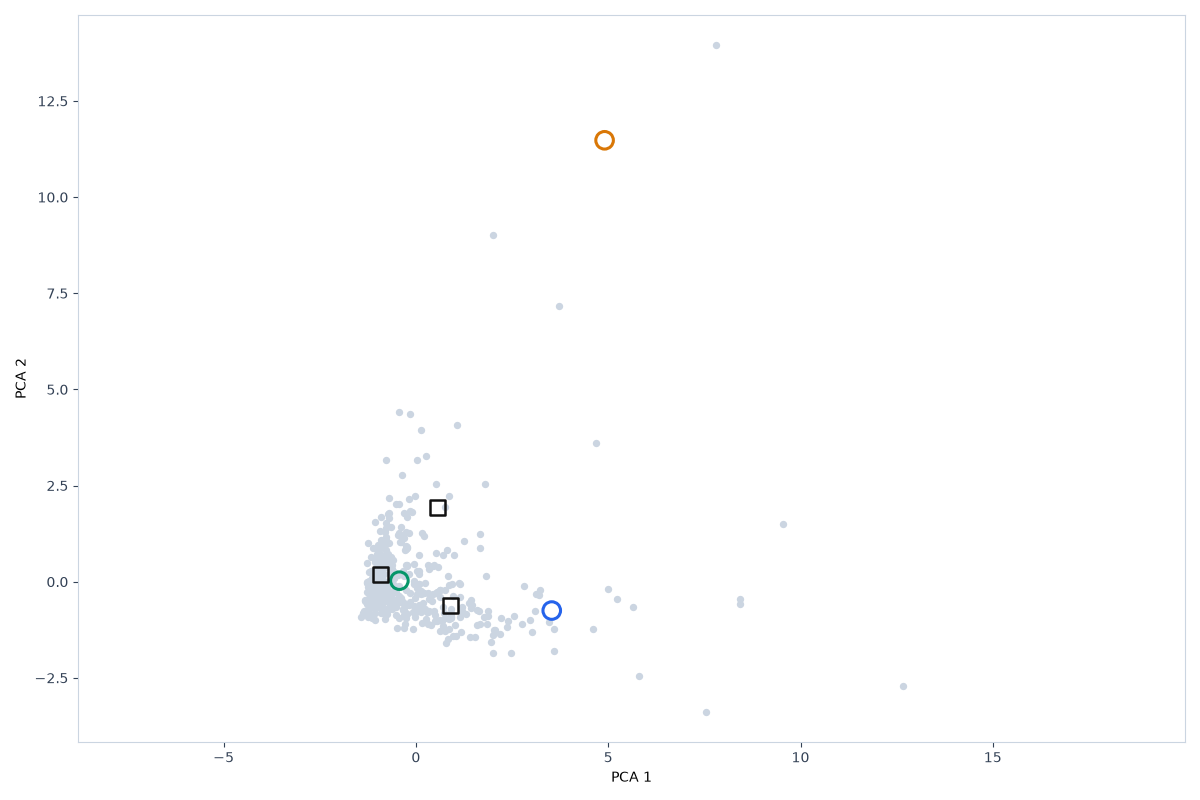
The link loads the six-column sample. K-Means is set to k=3. The Gaussian mixture is set to 3 components and full covariance. Run is still required.
from sklearn.cluster import KMeans
from sklearn.preprocessing import StandardScaler
Xs = StandardScaler().fit_transform(X)
labels = KMeans(n_clusters=3, n_init=10, random_state=42).fit_predict(Xs)
from sklearn.mixture import GaussianMixture
from sklearn.preprocessing import StandardScaler
Xs = StandardScaler().fit_transform(X)
labels = GaussianMixture(n_components=3, random_state=42).fit(Xs).predict(Xs)
A full-covariance Gaussian mixture on Iris Flowers (150 rows and 4 features) uses 3 components. Mixture silhouette is 0.374 and adjusted Rand against the held-out label is 0.904. K-Means uses 3 centroids on those rows, silhouette 0.460, adjusted Rand 0.620. The mixture cluster ids, each the component with the largest responsibility, agree more with the held-out column.
On Iris, silhouette is higher for K-Means (0.460 vs 0.374) while adjusted Rand is higher for the mixture (0.904 vs 0.620).
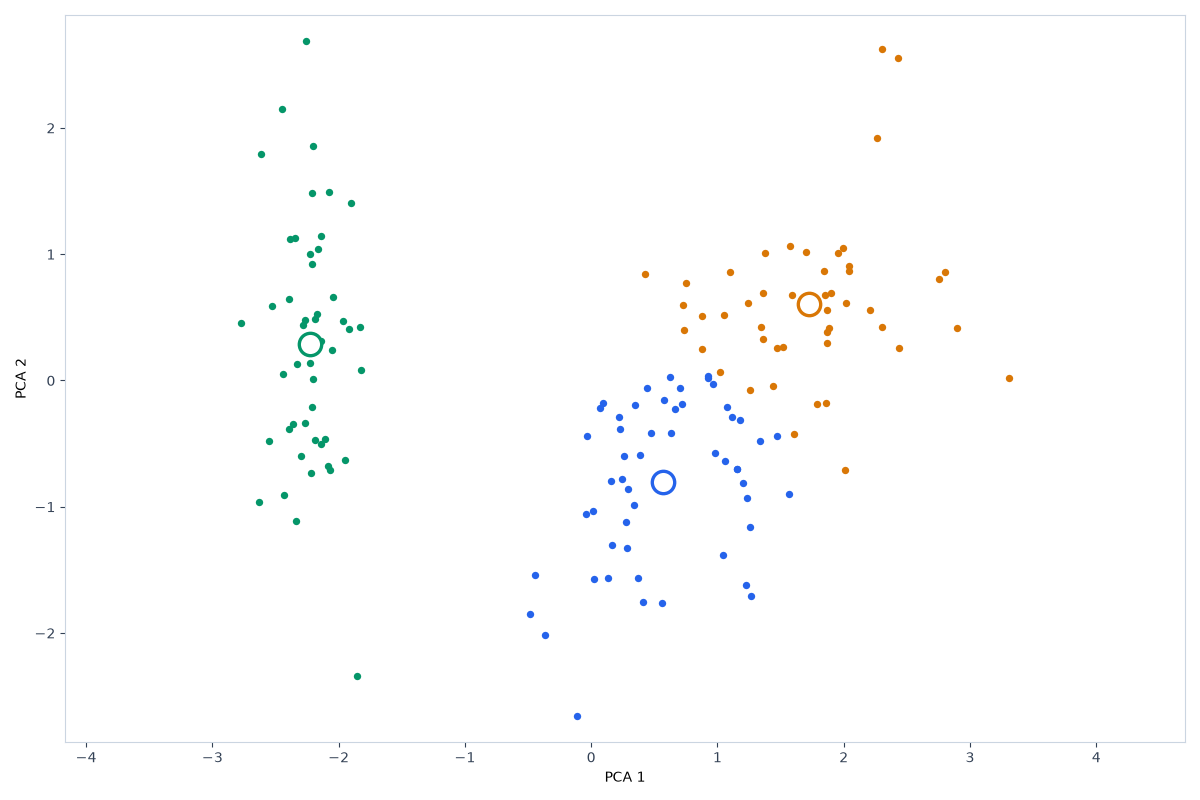
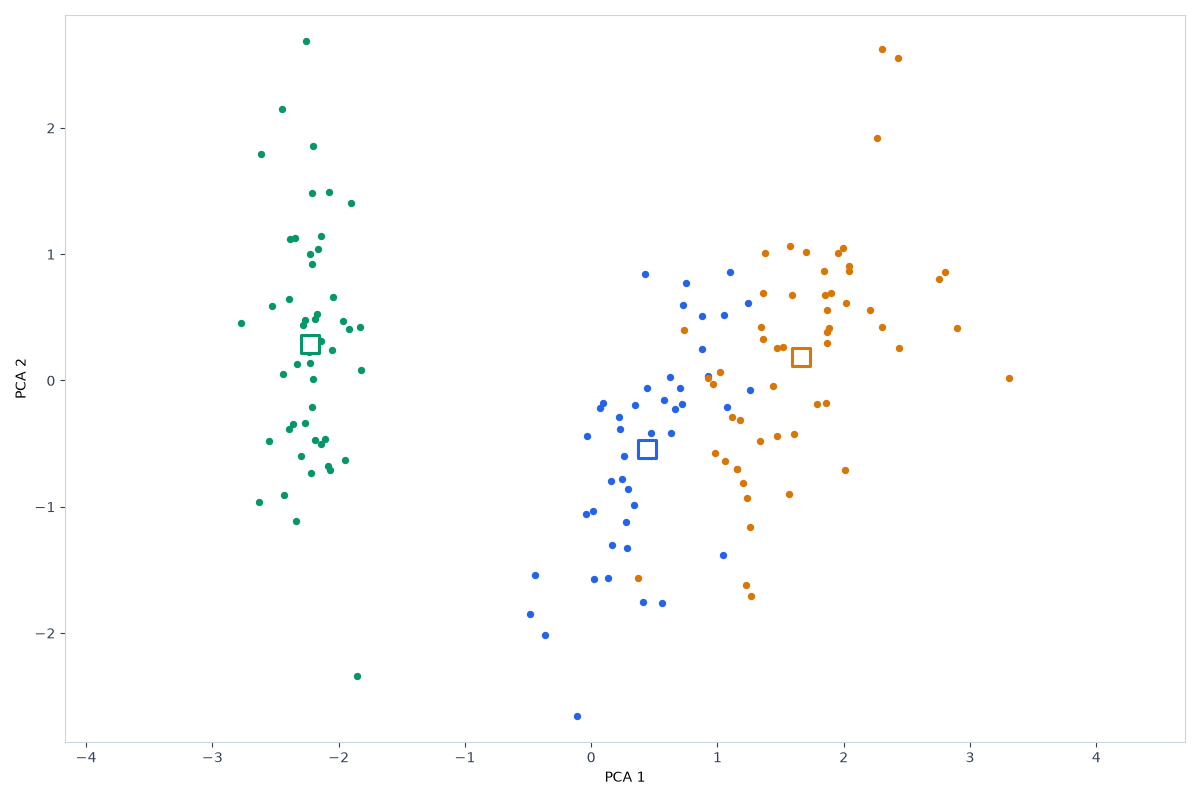
A full-covariance Gaussian mixture on Wine (UCI wine recognition) (178 rows and 13 features) uses 3 components. Mixture silhouette is 0.278 and adjusted Rand against the held-out label is 0.929. K-Means uses 3 centroids on those rows, silhouette 0.285, adjusted Rand 0.897. The mixture cluster ids, each the component with the largest responsibility, agree more with the held-out column.
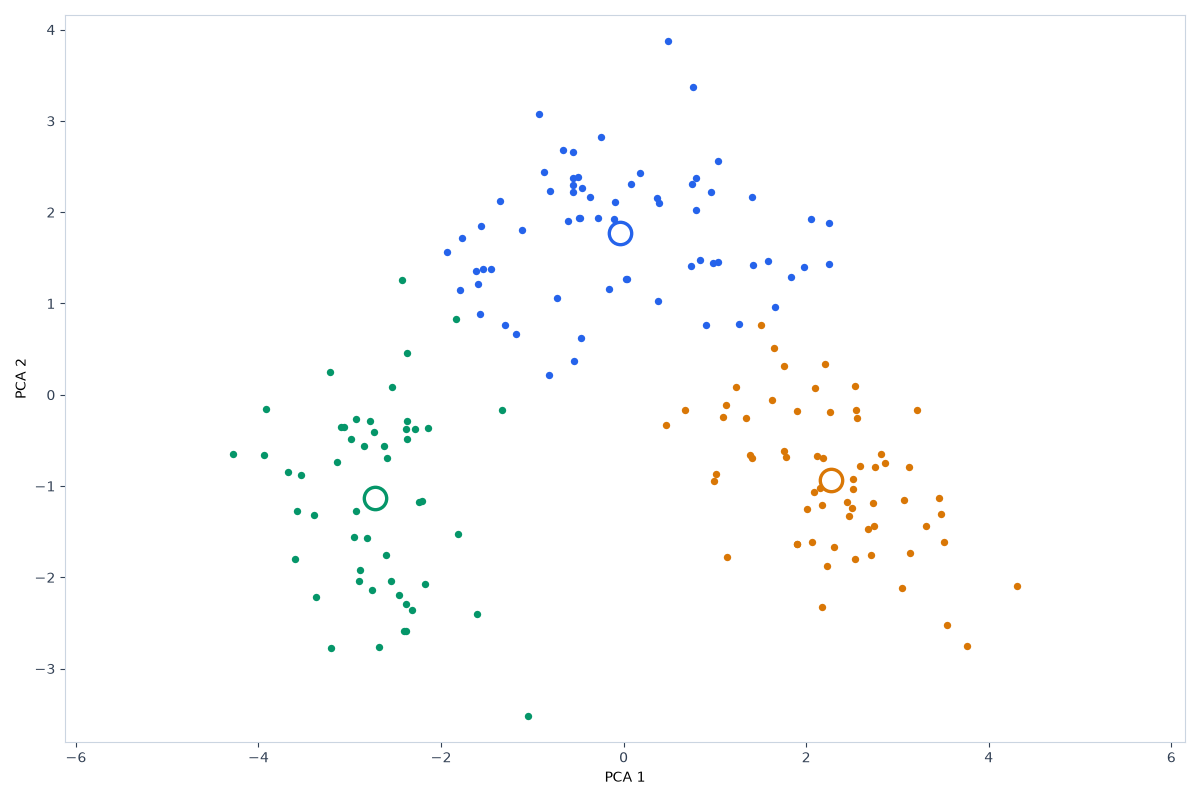
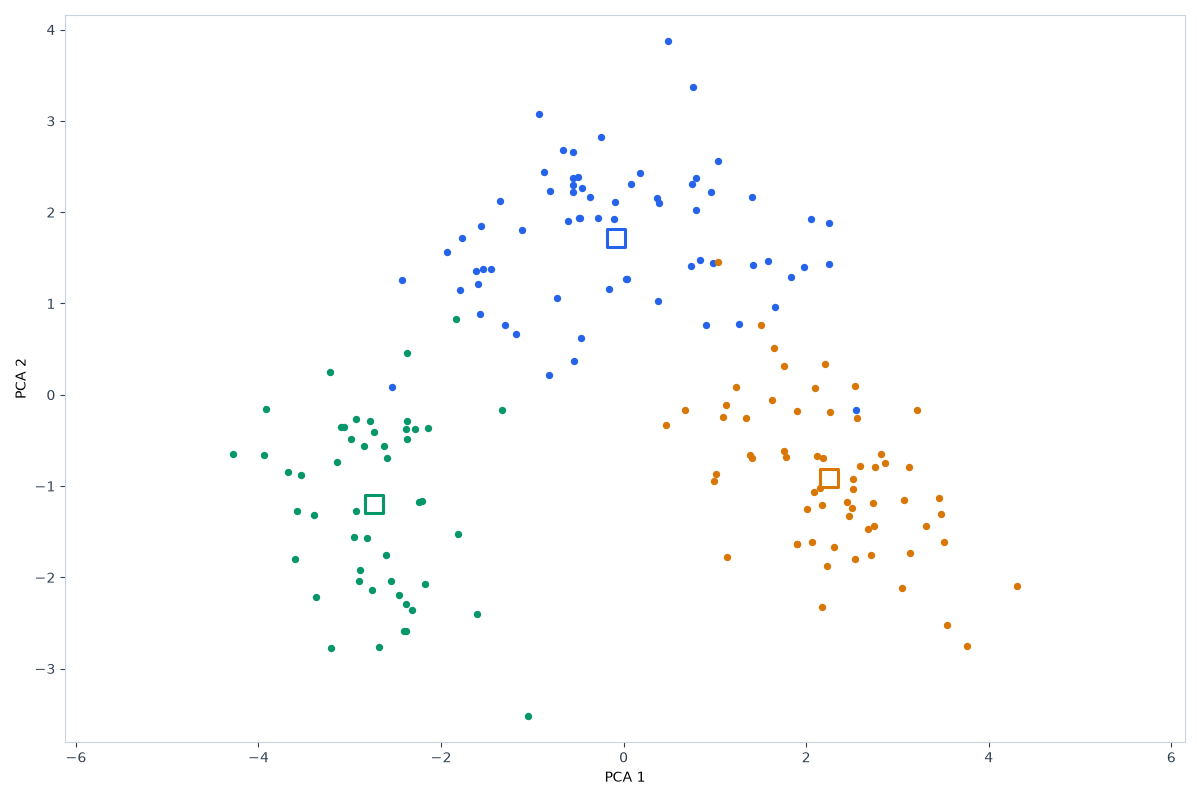
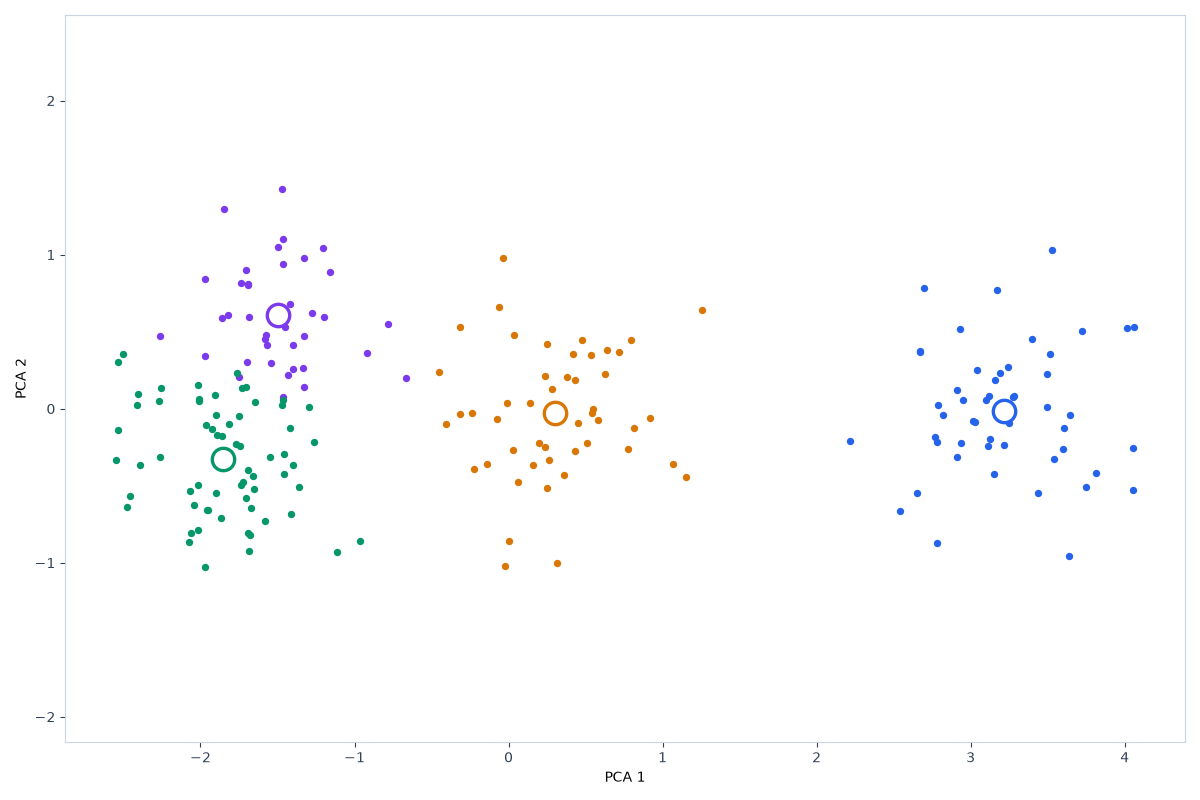
A full-covariance Gaussian mixture on Customer Segments (200 rows and 5 features) uses 4 components. Mixture silhouette is 0.402 and adjusted Rand against the held-out label is 0.659. K-Means uses 4 centroids on those rows, silhouette 0.368, adjusted Rand 0.763. The centroid labels agree more with the held-out column.
| Dataset | Algorithm | Clusters | Noise | Silhouette | Adjusted Rand |
|---|---|---|---|---|---|
| Wholesale Customers | K-Means | 3 | 0 | 0.548 | — |
| Wholesale Customers | Gaussian mixture | 3 | 0 | 0.219 | — |
| Iris Flowers | K-Means Clustering | 3 | 0 | 0.460 | 0.620 |
| Iris Flowers | Gaussian Mixture Model (GMM) | 3 | 0 | 0.374 | 0.904 |
| Wine (UCI wine recognition) | K-Means Clustering | 3 | 0 | 0.285 | 0.897 |
| Wine (UCI wine recognition) | Gaussian Mixture Model (GMM) | 3 | 0 | 0.278 | 0.929 |
| Customer Segments | K-Means Clustering | 4 | 0 | 0.368 | 0.763 |
| Customer Segments | Gaussian Mixture Model (GMM) | 4 | 0 | 0.402 | 0.659 |
A K-Means centroid is the mean of the rows assigned to it, so the center can sit between those customers. A full Gaussian mixture gives each row a probability across components, and each component has a mean and a covariance.
This is a choice, not a measured winner.
The six spend columns are right-skewed, so a mean can be pulled by the tail, while the Gaussian mixture uses 3 components with silhouette 0.21858 against K-Means silhouette 0.548287 on 3 clusters.
Method: StandardScaler, drop constant columns. Code version 3e4afc4b4352 (scripts/seo/build_explore_artifacts.py). scikit-learn 1.4.2. Seed 42. Both algorithms were fit on the same scaled table. Where a label column exists, it was held out of the fit and scored with adjusted Rand. Iris Flowers: UCI Machine Learning Repository, Iris (Fisher, 1936). License: CC BY 4.0. Wine (UCI wine recognition): UCI Machine Learning Repository, wine recognition. License: CC BY 4.0. Customer Segments: Synthetic customer records bundled with this site. License: Generated for demos; no external license.
Results computed, published, and last updated on 2026-11-02.
The comparison sentences are filled from these published runs by a fixed template, so the scores can be checked against the same datasets in the tool.
Maintainer: nikolaou1982.
Contact: nick1982100@gmail.com.