
K-Means
- Rows
- One cluster each.
- Center
- A mean.
- Distance
- Euclidean.
Loading…
K-Means assigns each row to the nearest mean. Spectral clustering builds an RBF affinity graph, with gamma equal to 1 over the feature count, and cuts that graph into a fixed number of clusters.
Choose whether the groups come from nearest means or an RBF graph.
This is a choice, not a measured winner.
Silhouette is within 0.01 on Iris Flowers, Wine (UCI wine recognition), and Customer Segments; K-Means Clustering agrees more with the held-out label on Iris Flowers and Customer Segments; Spectral Clustering agrees more with the held-out label on Wine (UCI wine recognition).
Do you need a graph cut instead of nearest means?
An RBF affinity graph, instead of a mean for each cluster.
Spectral clustering on Iris Flowers (150 rows and 4 features) cuts an RBF affinity graph into 3 clusters, silhouette 0.460, adjusted Rand 0.600. K-Means places 3 means on the same scaled rows, silhouette 0.460, adjusted Rand 0.620. The mean-centroid labels match the held-out column more closely.
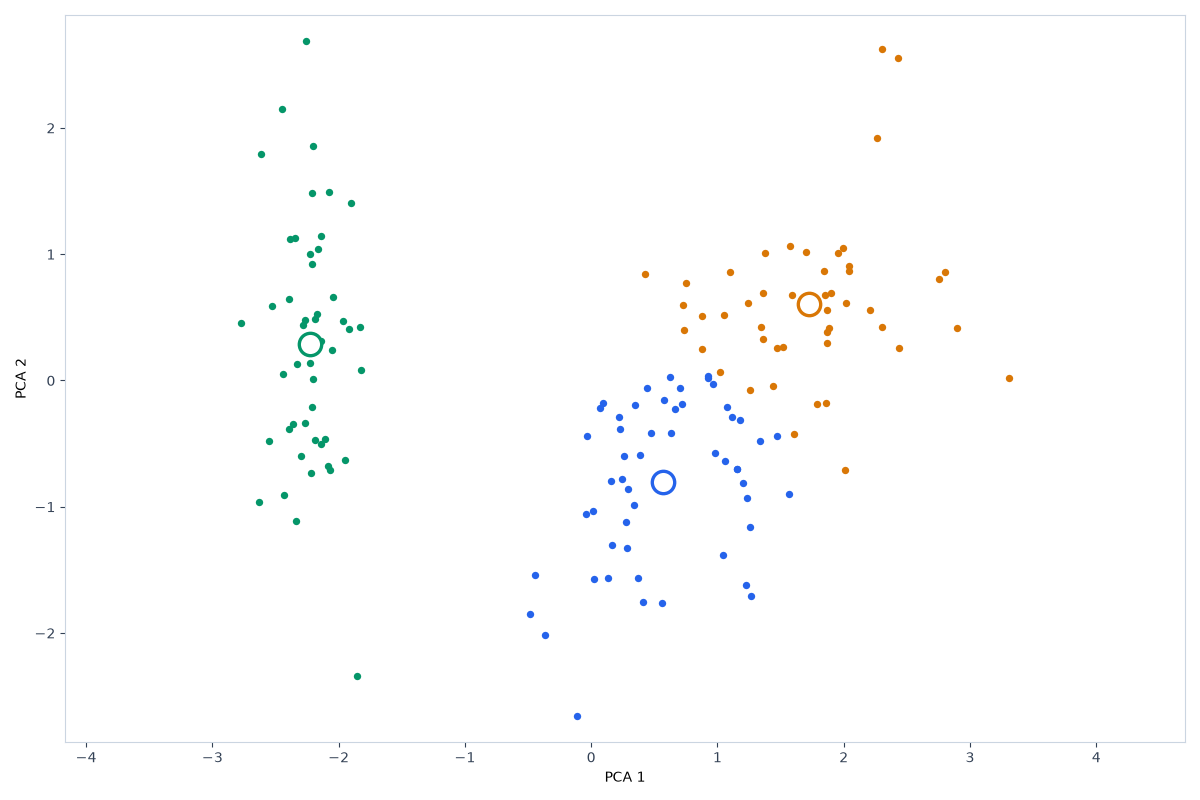
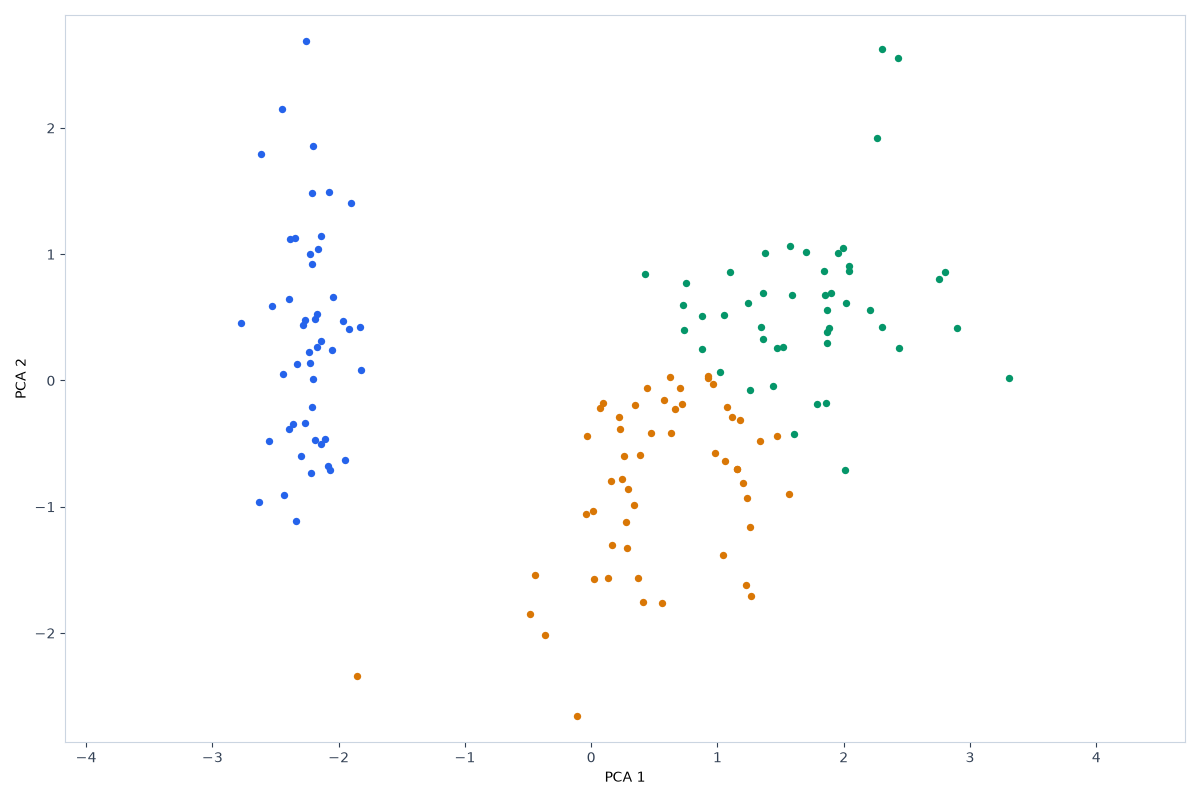
The link loads the sample. Run is still required.
Spectral clustering on Wine (UCI wine recognition) (178 rows and 13 features) cuts an RBF affinity graph into 3 clusters, silhouette 0.283, adjusted Rand 0.930. K-Means places 3 means on the same scaled rows, silhouette 0.285, adjusted Rand 0.897. The RBF graph cut matches the held-out column more closely.
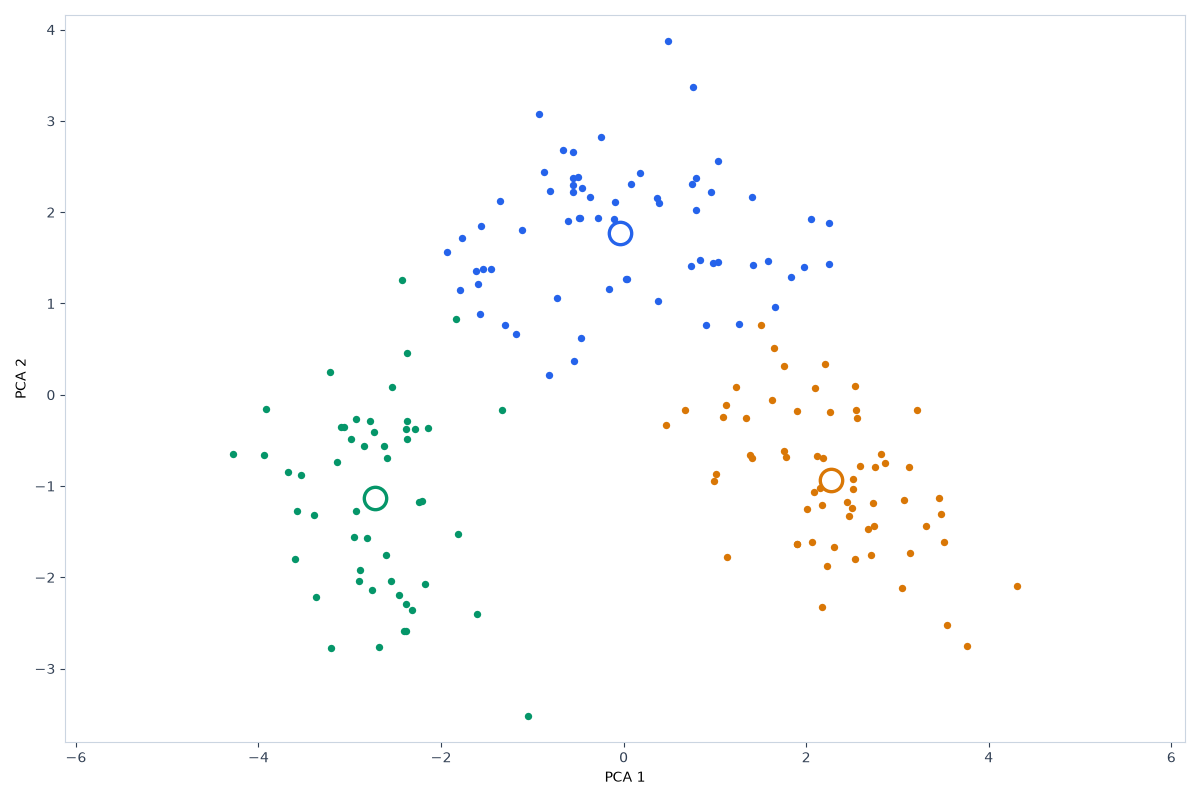
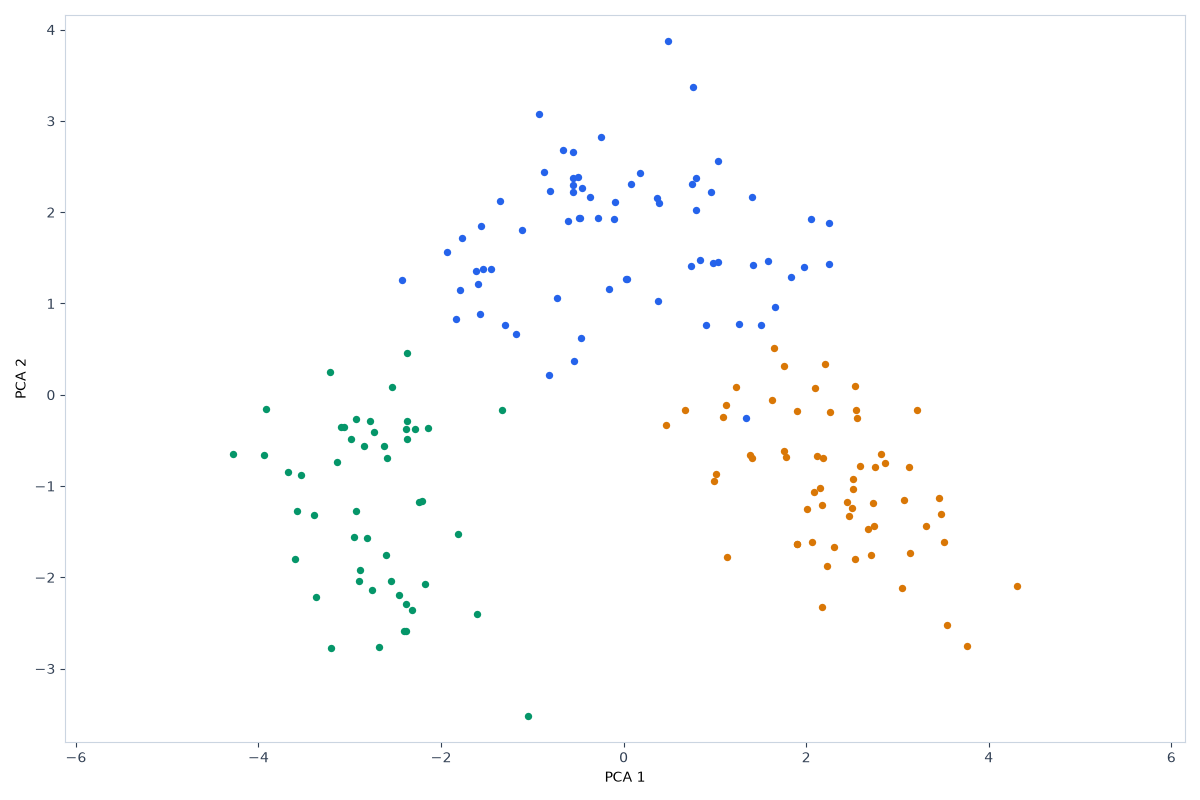
The link loads the sample. Run is still required.
Spectral clustering on Customer Segments (200 rows and 5 features) cuts an RBF affinity graph into 4 clusters, silhouette 0.367, adjusted Rand 0.751. K-Means places 4 means on the same scaled rows, silhouette 0.368, adjusted Rand 0.763. The mean-centroid labels match the held-out column more closely.
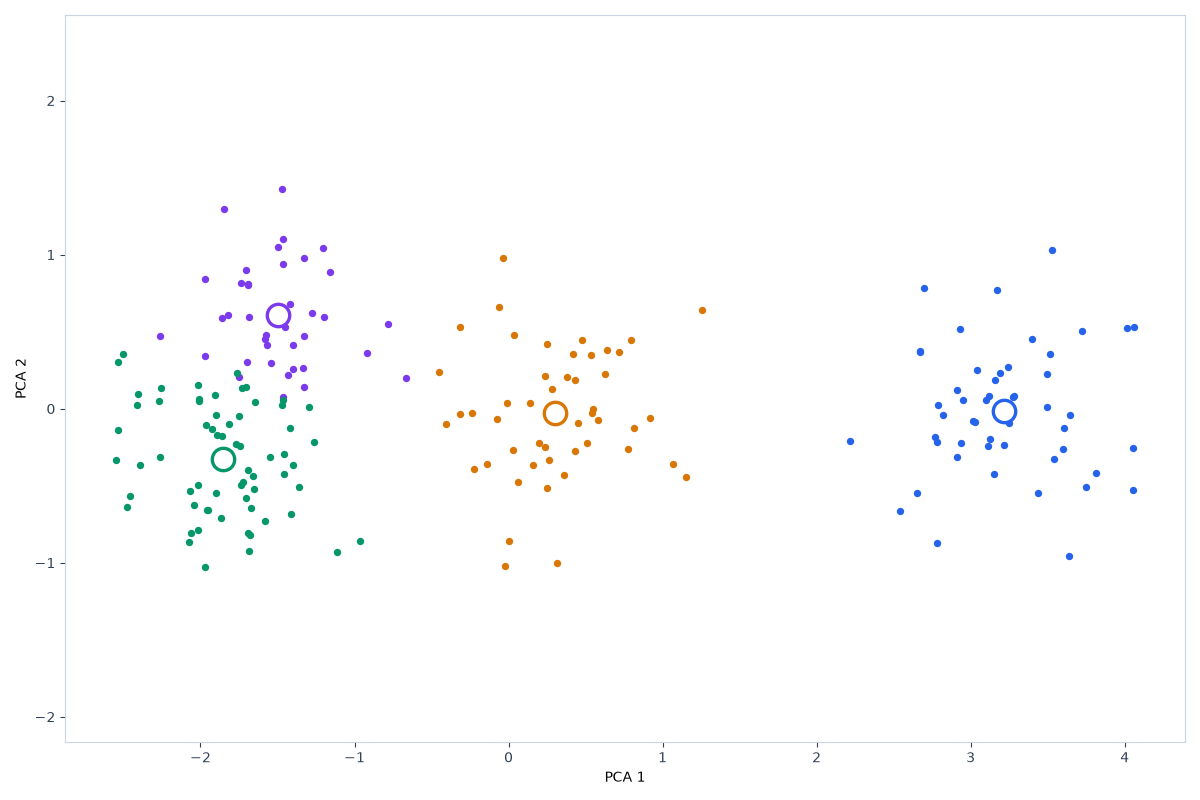
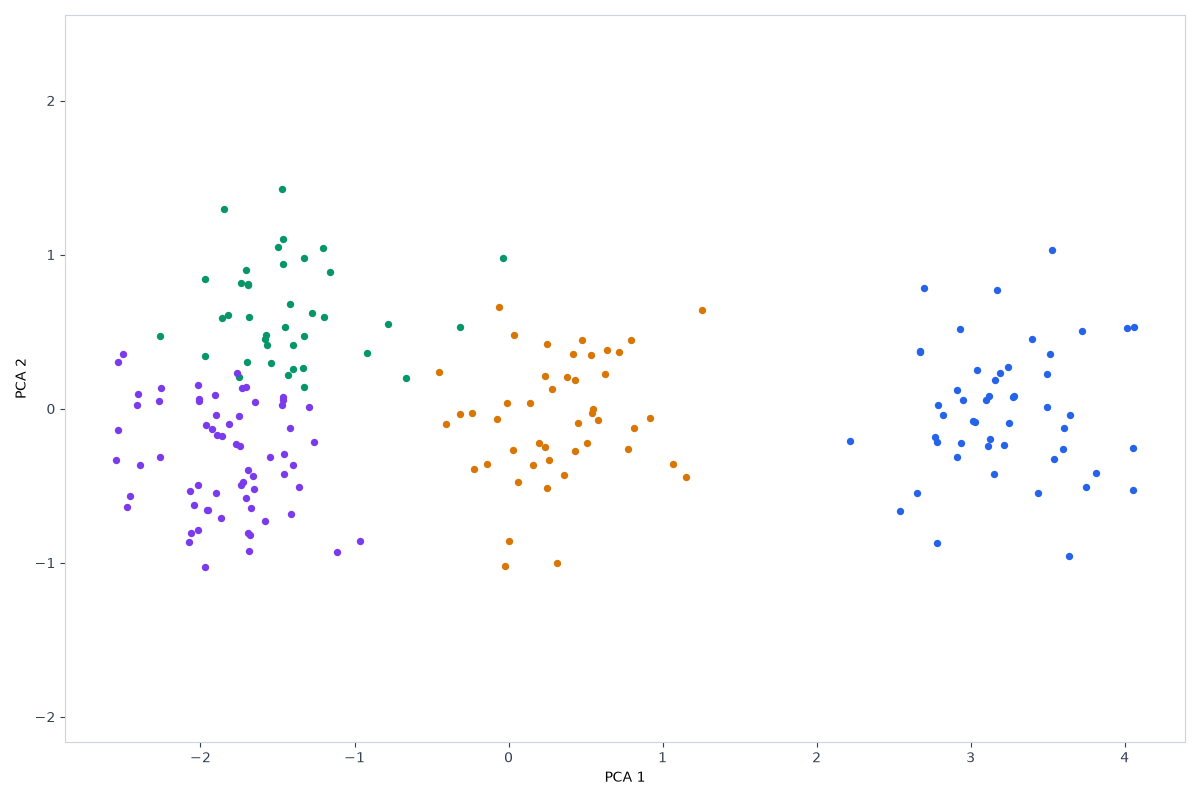
The link loads the sample. Run is still required.
| Dataset | Algorithm | Clusters | Noise | Silhouette | Adjusted Rand |
|---|---|---|---|---|---|
| Iris Flowers | K-Means Clustering | 3 | 0 | 0.460 | 0.620 |
| Iris Flowers | Spectral Clustering | 3 | 0 | 0.460 | 0.600 |
| Wine (UCI wine recognition) | K-Means Clustering | 3 | 0 | 0.285 | 0.897 |
| Wine (UCI wine recognition) | Spectral Clustering | 3 | 0 | 0.283 | 0.930 |
| Customer Segments | K-Means Clustering | 4 | 0 | 0.368 | 0.763 |
| Customer Segments | Spectral Clustering | 4 | 0 | 0.367 | 0.751 |
K-Means assigns each row to the nearest mean. Spectral clustering builds an RBF affinity graph, with gamma equal to 1 over the feature count, and cuts that graph into a fixed number of clusters.
Method: StandardScaler, drop constant columns. Code version 3e4afc4b4352 (scripts/seo/build_explore_artifacts.py). scikit-learn 1.4.2. Seed 42. Both algorithms were fit on the same scaled table. Where a label column exists, it was held out of the fit and scored with adjusted Rand. Iris Flowers: UCI Machine Learning Repository, Iris (Fisher, 1936). License: CC BY 4.0. Wine (UCI wine recognition): UCI Machine Learning Repository, wine recognition. License: CC BY 4.0. Customer Segments: Synthetic customer records bundled with this site. License: Generated for demos; no external license.
Results computed, published, and last updated on 2026-11-02.
The comparison sentences are filled from these published runs by a fixed template, so the scores can be checked against the same datasets in the tool.
Maintainer: nikolaou1982.
Contact: nick1982100@gmail.com.