
Results of this run
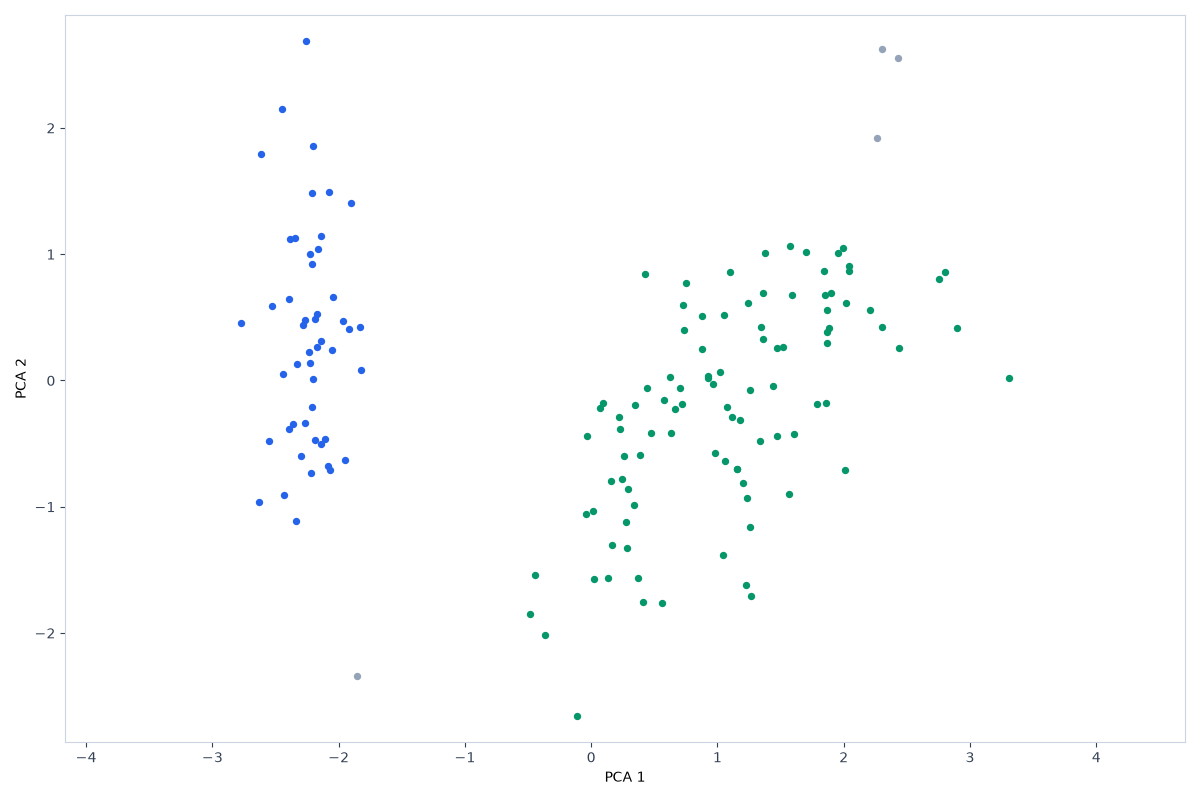
DBSCAN density on Iris Flowers uses eps 0.85854 and minSamples 5. Density silhouette is 0.598 (undefined when fewer than two dense regions). Density Calinski-Harabasz is 277.7. Density Davies-Bouldin is 0.569. Held-out species versus dense regions: adjusted Rand 0.552. 4 noise rows out of 150 failed the core-point rule. Dense region 0 on Iris Flowers holds 49 rows (petal length (cm) 1.47 / petal width (cm) 0.24). Dense region 1 on Iris Flowers holds 97 rows (petal length (cm) 4.86 / petal width (cm) 1.66). minSamples sweep: min_samples 3 yields 0.605 with 2 groups on Iris Flowers; min_samples 5 yields 0.598 with 2 groups on Iris Flowers; min_samples 8 yields 0.595 with 2 groups on Iris Flowers. Density scatter keeps 95.8% via PCA.
| min_samples | Silhouette | Clusters |
|---|---|---|
| 3 | 0.605 | 2 |
| 5 | 0.598 | 2 |
| 8 | 0.595 | 2 |
from sklearn.cluster import DBSCAN
from sklearn.preprocessing import StandardScaler
Xs = StandardScaler().fit_transform(X)
labels = DBSCAN(eps=0.85854, min_samples=5).fit_predict(Xs)
Who, how, and why
Method: StandardScaler, drop constant columns. Code version 3e4afc4b4352 (scripts/seo/build_explore_artifacts.py). scikit-learn 1.4.2. Seed 42. Dataset source: UCI Machine Learning Repository, Iris (Fisher, 1936). License: CC BY 4.0. The species column was held out of the fit and used only for the adjusted Rand score.
Results computed on 2026-11-02.
The results paragraph is filled from these numbers by a fixed template in the site code, so the scores can be checked against the same dataset in the tool.
Maintainer: nikolaou1982.
Contact: nick1982100@gmail.com.