
t-SNE
- Perplexity
- Perplexity.
- Neighborhoods
- Local neighborhoods.
Loading…
t-SNE and UMAP both place each row so that its neighbors stay neighbors. t-SNE follows perplexity. UMAP follows a neighbor count and a minimum distance. Neither map reports a variance share.
Choose the map the table needs.
This is a choice, not a measured winner.
t-SNE has no transform, and this product places a later row by 5-neighbor interpolation into the fitted map, which is approximate. A later row uses the fitted UMAP map.
t-SNE keeps more original neighborhoods on Wine (UCI wine recognition) and Customer Segments; Trustworthiness is within 0.01 on Iris Flowers.
Do you need the fitted map to place a later row?
UMAP applies its fitted map. t-SNE places a later row by neighbor interpolation.
t-SNE on Iris Flowers (150 rows, 4 features) uses perplexity 30 and reaches trustworthiness 0.991 with KL divergence 0.170. UMAP uses 15 neighbors and min_dist 0.1 and reaches trustworthiness 0.985. The color is held-out species, withheld from both fits. The two maps are within 0.01 trustworthiness.
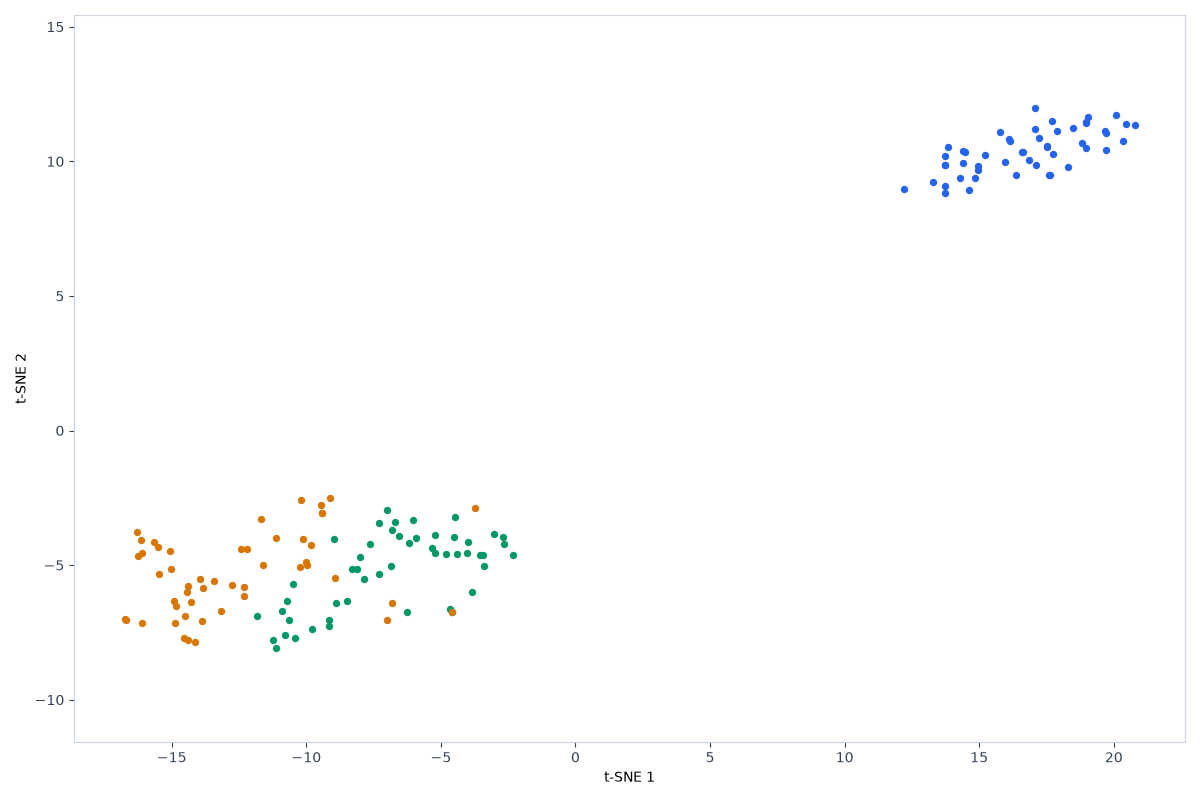
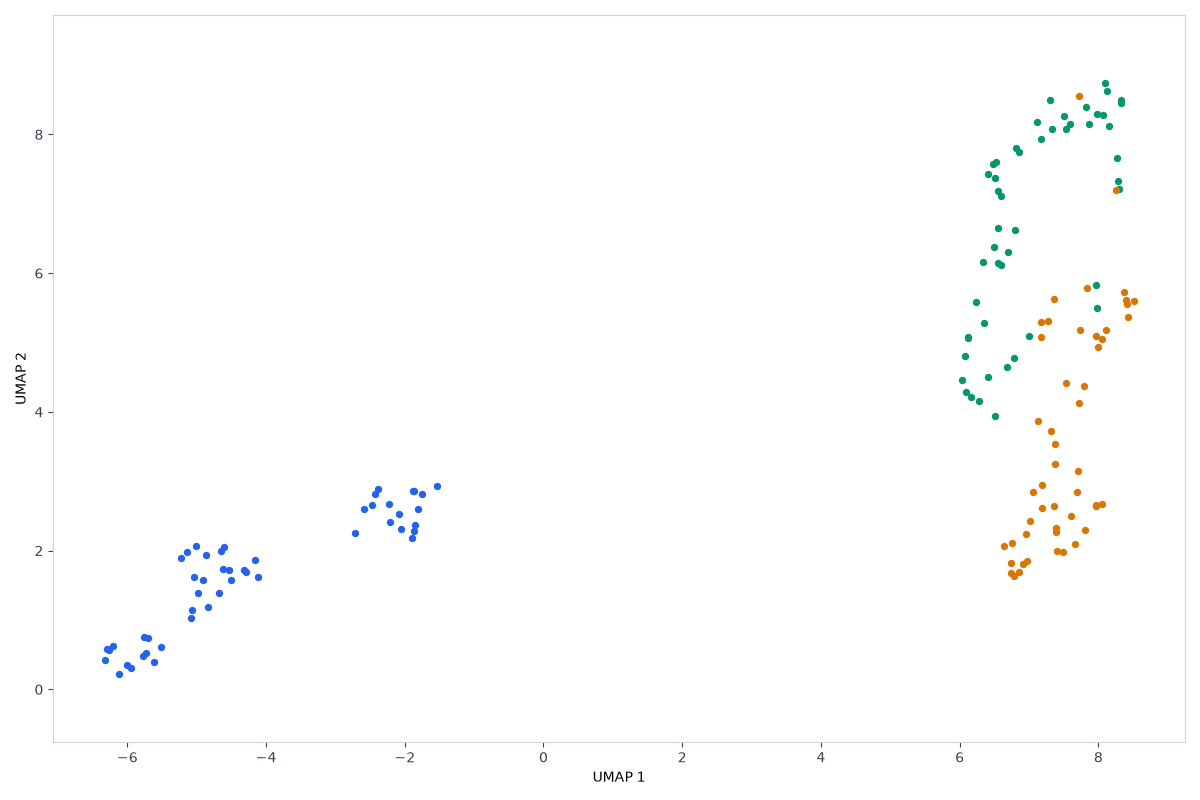
t-SNE on Wine (UCI wine recognition) (178 rows, 13 features) uses perplexity 30 and reaches trustworthiness 0.962 with KL divergence 0.367. UMAP uses 15 neighbors and min_dist 0.1 and reaches trustworthiness 0.952. The color is held-out wine_class, withheld from both fits. t-SNE keeps more of the original neighborhoods in this picture.
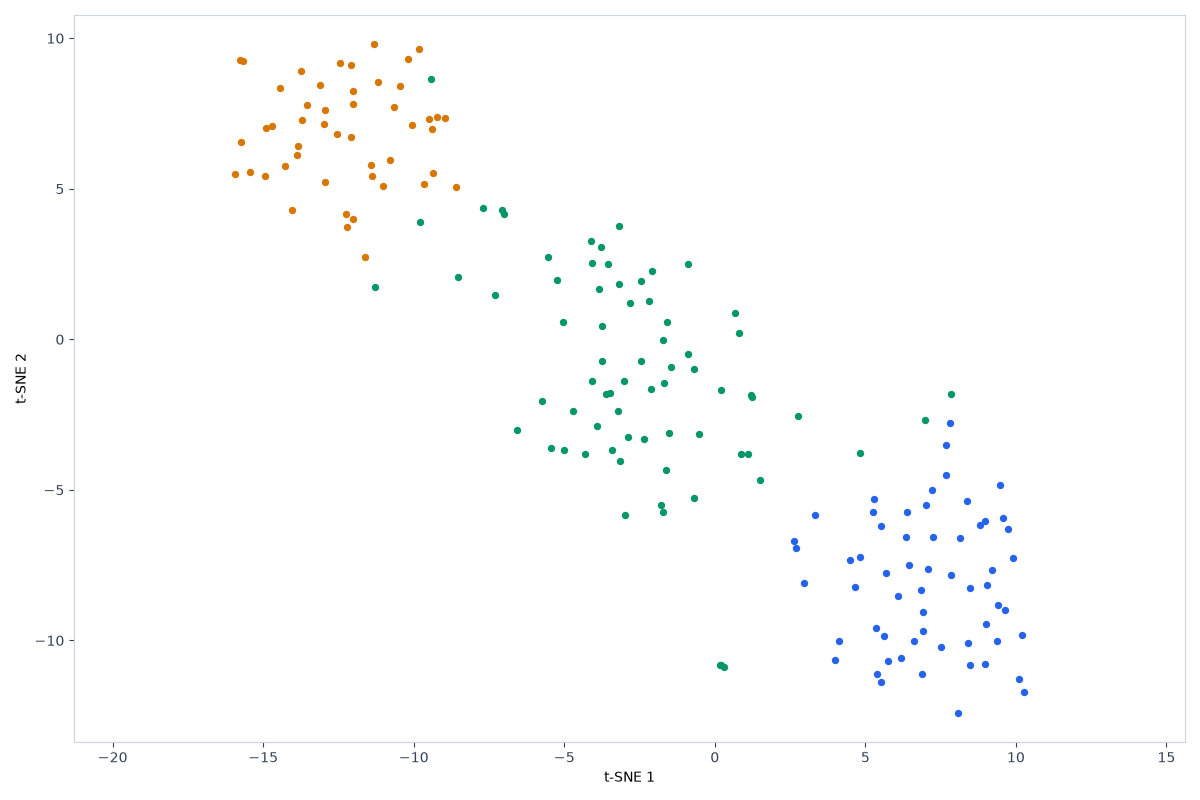
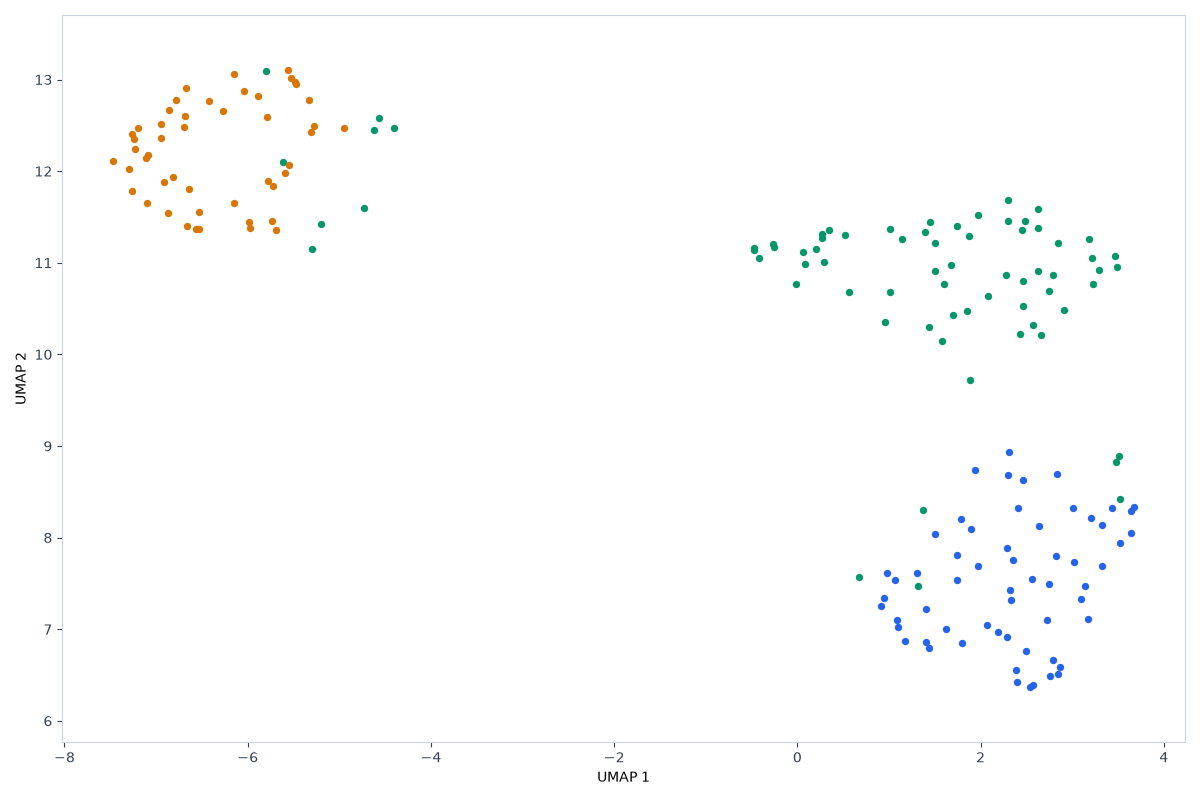
t-SNE on Customer Segments (200 rows, 5 features) uses perplexity 30 and reaches trustworthiness 0.979 with KL divergence 0.343. UMAP uses 15 neighbors and min_dist 0.1 and reaches trustworthiness 0.966. The color is held-out segment, withheld from both fits. t-SNE keeps more of the original neighborhoods in this picture.
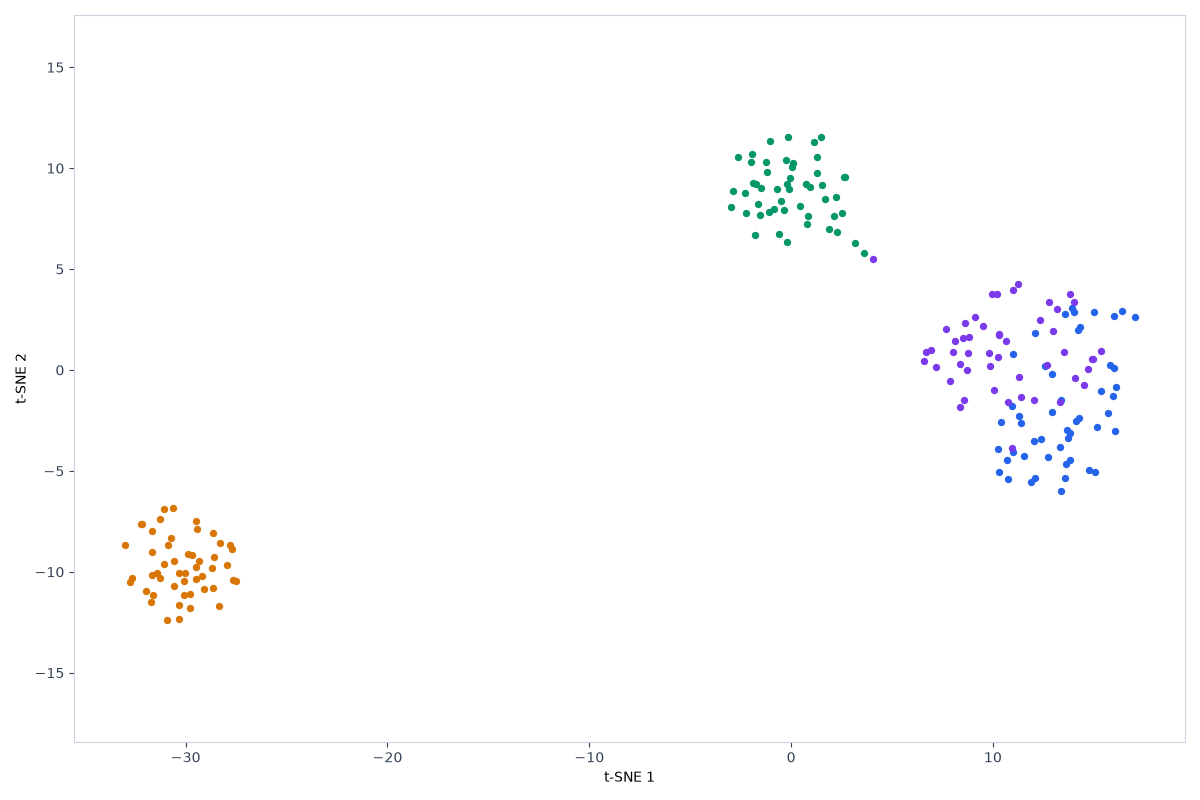
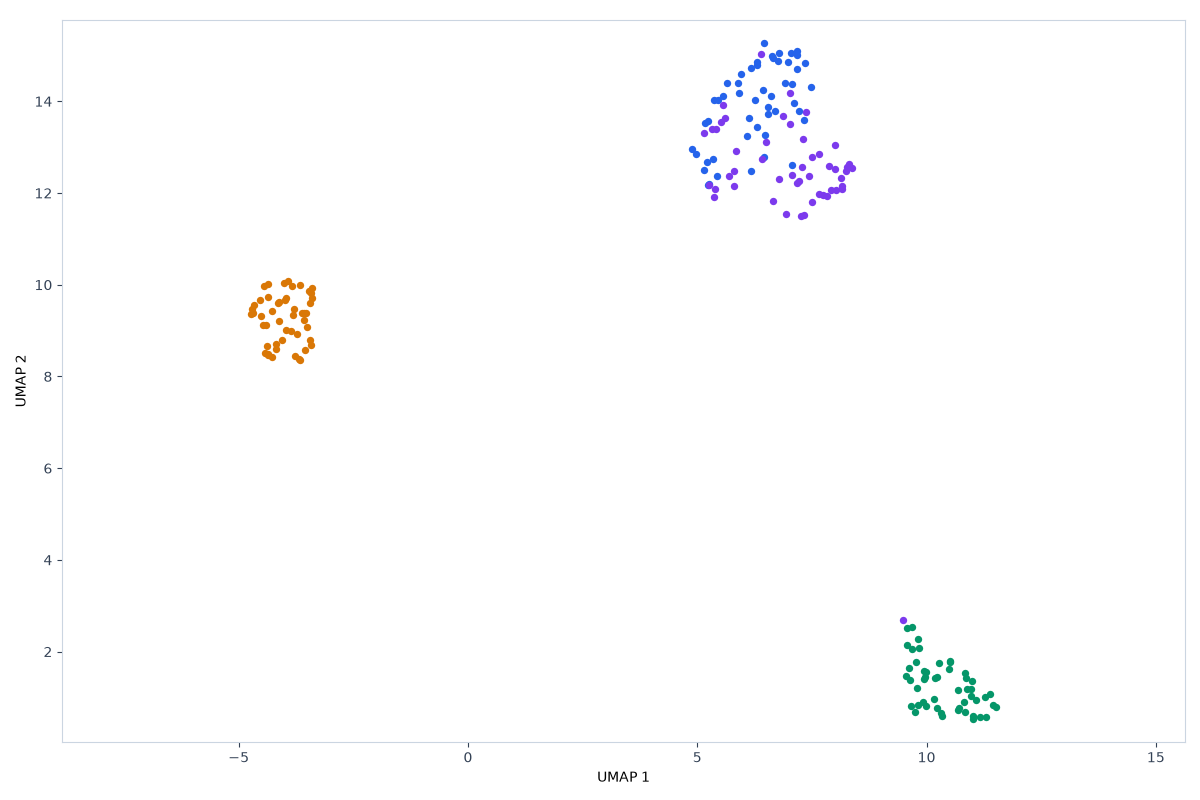
Blob size, tightness, and gaps in the t-SNE picture are layout; perplexity 30 sets the neighborhood, and UMAP min_dist 0.1 sets how tightly its neighbors pack.
| Dataset | Method | Trustworthiness | Also reported |
|---|---|---|---|
| Iris Flowers | t-SNE | 0.991 | KL divergence 0.170 |
| Iris Flowers | UMAP | 0.985 | no variance or KL figure |
| Wine (UCI wine recognition) | t-SNE | 0.962 | KL divergence 0.367 |
| Wine (UCI wine recognition) | UMAP | 0.952 | no variance or KL figure |
| Customer Segments | t-SNE | 0.979 | KL divergence 0.343 |
| Customer Segments | UMAP | 0.966 | no variance or KL figure |
t-SNE and UMAP both place each row so that its neighbors stay neighbors. t-SNE follows perplexity. UMAP follows a neighbor count and a minimum distance. Neither map reports a variance share.
This is a choice, not a measured winner.
Neither t-SNE nor UMAP ranks or drops columns. These compare runs do not publish loadings.
Method: StandardScaler, drop constant columns. Comparison code version 8fbe69461da4 (scripts/seo/build_compare_runs.py). scikit-learn 1.4.2. Seed 42. The class column was held out of every fit. Iris Flowers: UCI Machine Learning Repository, Iris (Fisher, 1936). License: CC BY 4.0. Wine (UCI wine recognition): UCI Machine Learning Repository, wine recognition. License: CC BY 4.0. Customer Segments: Synthetic customer records bundled with this site. License: Generated for demos; no external license.
Results computed, published, and last updated on 2026-11-03.
The comparison sentences are filled from these published runs by a fixed template, so the scores can be checked against the same datasets in the tool.
Maintainer: nikolaou1982.
Contact: nick1982100@gmail.com.