
PCA
- Form
- Linear.
- Score
- Variance.
- Components
- A fixed number of components.
Loading…
PCA keeps the directions of greatest variance as a linear summary of the columns. UMAP places each row so that its neighbors stay neighbors. UMAP follows a neighbor count and a minimum distance, and it does not report a variance share.
Choose the map the table needs.
This is a choice, not a measured winner.
A new row uses the fitted PCA axes. A later row uses the fitted UMAP map.
UMAP keeps more original neighborhoods on Iris Flowers, Wine (UCI wine recognition), and Customer Segments; PCA still reports the variance those two axes keep: 95.8% on Iris Flowers, 55.4% on Wine (UCI wine recognition), 90.5% on Customer Segments.
Do you need the directions of greatest variance?
A linear summary of the columns, or a map where neighbors stay neighbors.
PCA on Iris Flowers (150 rows, 4 features) retains 95.8% of the variance, trustworthiness 0.974. UMAP with 15 neighbors and min_dist 0.1 reaches trustworthiness 0.985 and does not report a variance share. Points are colored by held-out species. UMAP keeps more of the original neighborhoods in this picture. The linear map is the one that states how much variance the two axes keep.
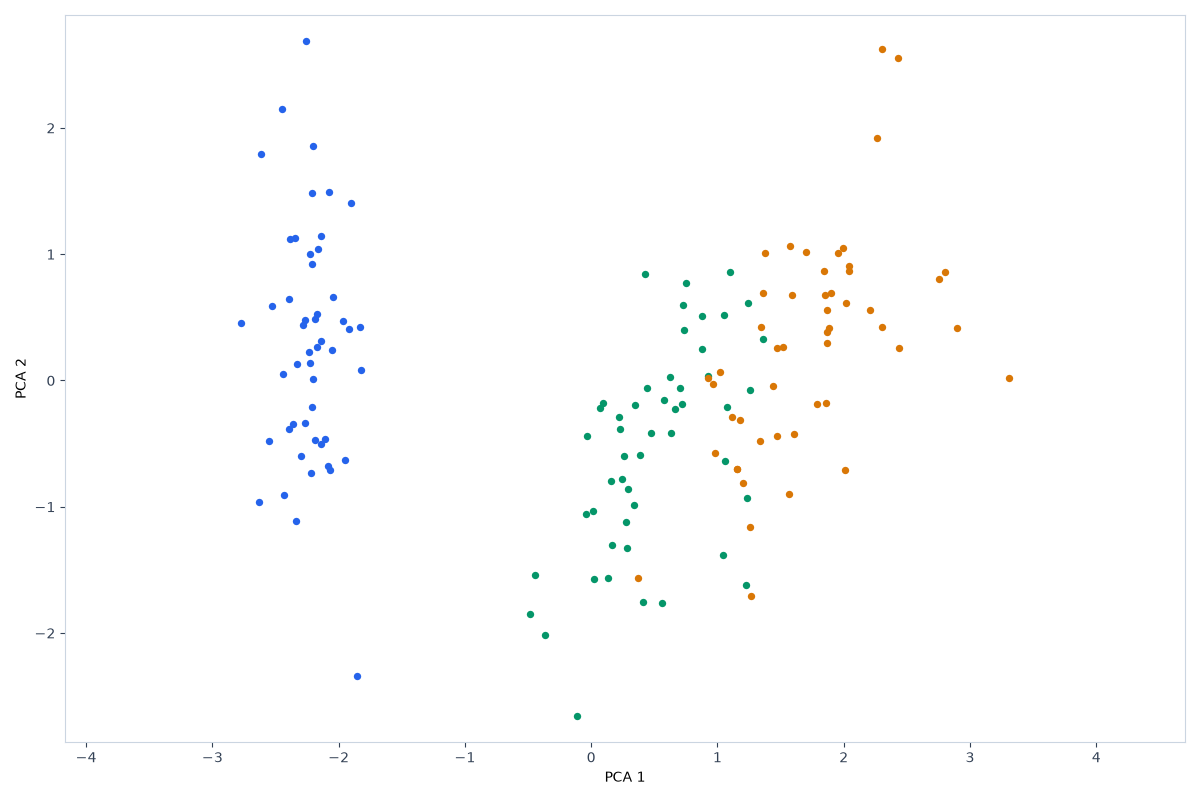
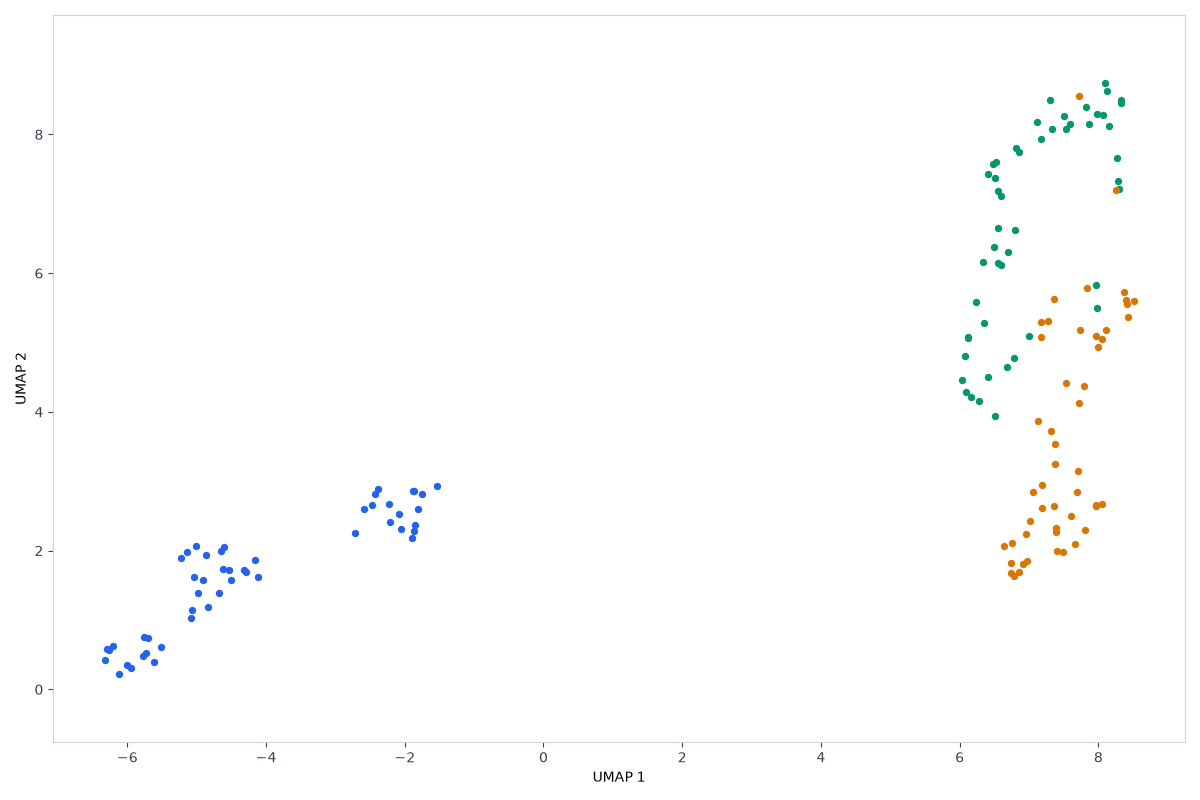
PCA on Wine (UCI wine recognition) (178 rows, 13 features) retains 55.4% of the variance, trustworthiness 0.871. UMAP with 15 neighbors and min_dist 0.1 reaches trustworthiness 0.952 and does not report a variance share. Points are colored by held-out wine_class. UMAP keeps more of the original neighborhoods in this picture. The linear map is the one that states how much variance the two axes keep.
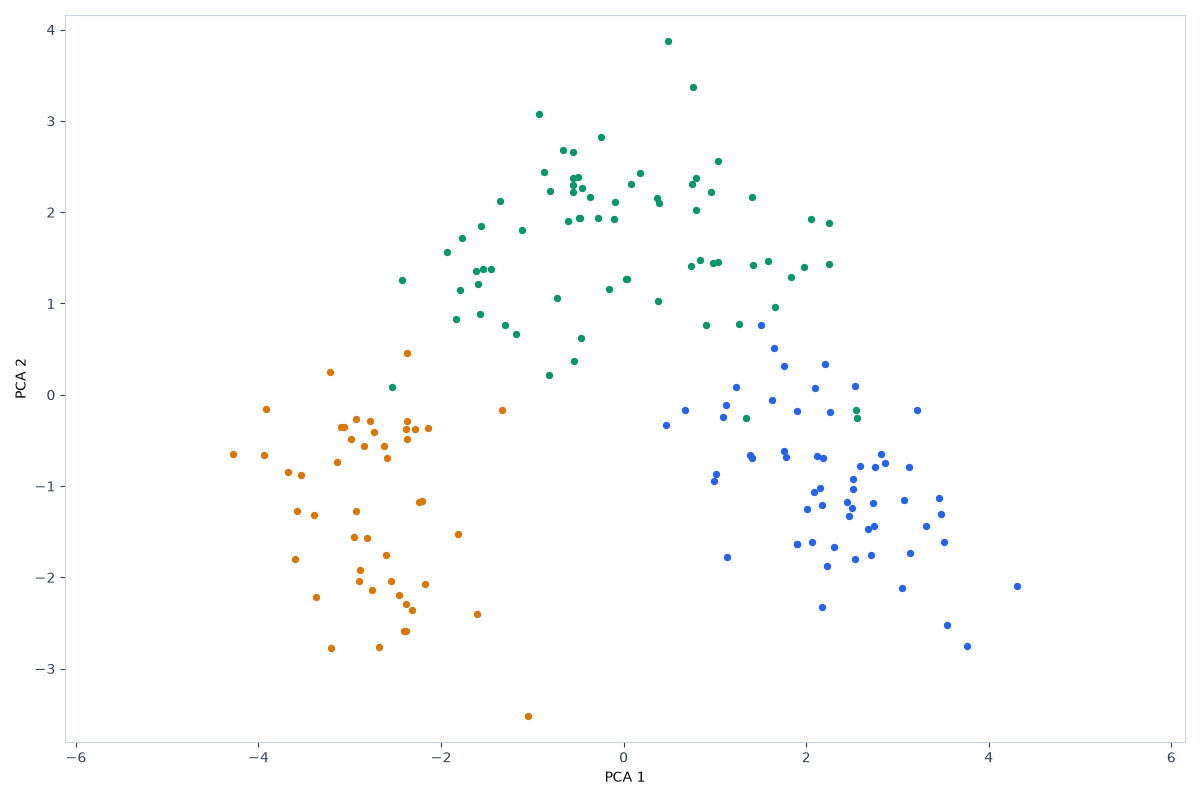
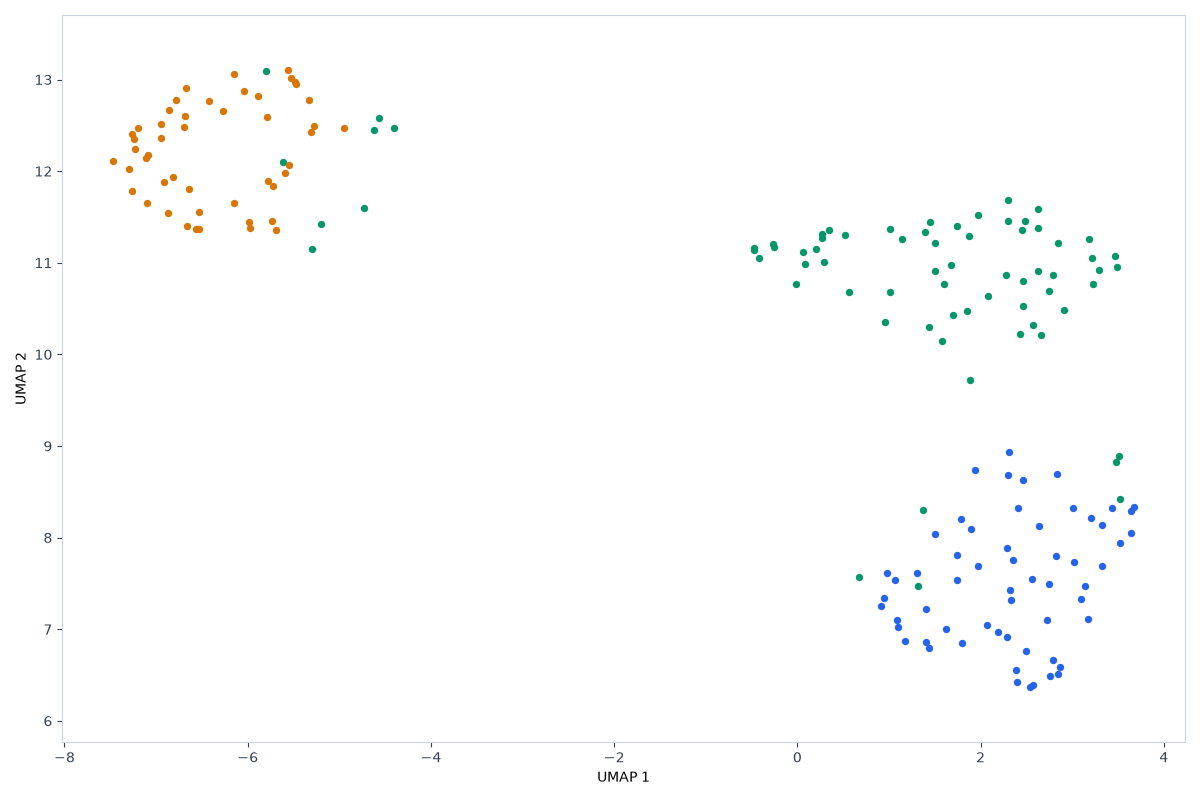
PCA on Customer Segments (200 rows, 5 features) retains 90.5% of the variance, trustworthiness 0.927. UMAP with 15 neighbors and min_dist 0.1 reaches trustworthiness 0.966 and does not report a variance share. Points are colored by held-out segment. UMAP keeps more of the original neighborhoods in this picture. The linear map is the one that states how much variance the two axes keep.
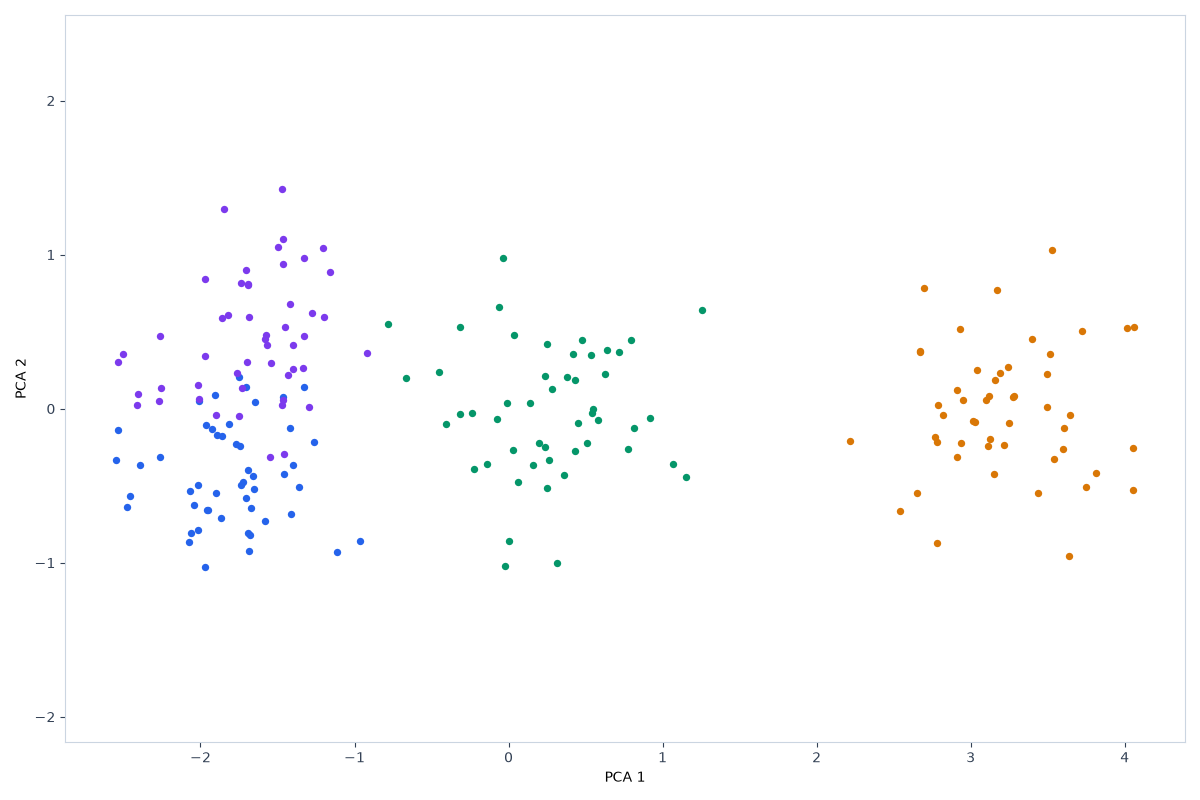
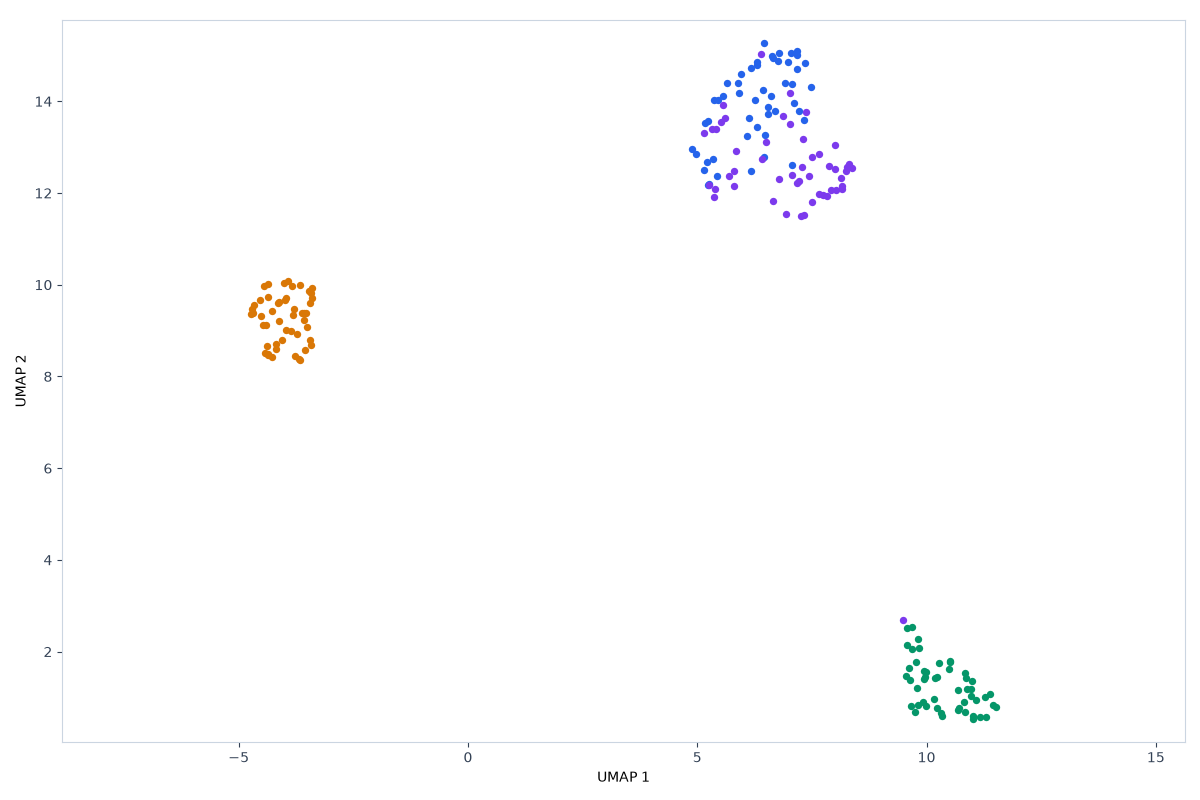
Tightness in the UMAP picture is layout; min_dist 0.1 sets how tightly its neighbors pack.
| Dataset | Method | Trustworthiness | Also reported |
|---|---|---|---|
| Iris Flowers | PCA | 0.974 | 95.8% variance in 2 components |
| Iris Flowers | UMAP | 0.985 | no variance or KL figure |
| Wine (UCI wine recognition) | PCA | 0.871 | 55.4% variance in 2 components |
| Wine (UCI wine recognition) | UMAP | 0.952 | no variance or KL figure |
| Customer Segments | PCA | 0.927 | 90.5% variance in 2 components |
| Customer Segments | UMAP | 0.966 | no variance or KL figure |
PCA keeps the directions of greatest variance as a linear summary of the columns. UMAP places each row so that its neighbors stay neighbors. UMAP follows a neighbor count and a minimum distance, and it does not report a variance share.
This is a choice, not a measured winner.
UMAP does not rank or drop columns. PCA loadings do. These compare runs do not publish loadings.
Method: StandardScaler, drop constant columns. Comparison code version 8fbe69461da4 (scripts/seo/build_compare_runs.py). scikit-learn 1.4.2. Seed 42. The class column was held out of every fit. Iris Flowers: UCI Machine Learning Repository, Iris (Fisher, 1936). License: CC BY 4.0. Wine (UCI wine recognition): UCI Machine Learning Repository, wine recognition. License: CC BY 4.0. Customer Segments: Synthetic customer records bundled with this site. License: Generated for demos; no external license.
Results computed, published, and last updated on 2026-11-03.
The comparison sentences are filled from these published runs by a fixed template, so the scores can be checked against the same datasets in the tool.
Maintainer: nikolaou1982.
Contact: nick1982100@gmail.com.