Titanic Survival dataset

400 synthetic passenger records with class, age, fare, and family size. Binary classification demo for who survived.

400 rows and 7 numeric columns. Creator: ML Clustering. License: Generated for demos; no external license. This table was generated for demos on this site and is not based on a UCI record.

Source: Synthetic survival records bundled with this site. License: Generated for demos; no external license.

Columns

Columns listed for this table
ColumnWhat it holds
pclassNumeric measurement.
sexNumeric measurement.
ageNumeric measurement.
sibspNumeric measurement.
parchNumeric measurement.
fareNumeric measurement.
embarkedNumeric measurement.
survivedLabel column. Values: died, survived.

Describe it on the canvas

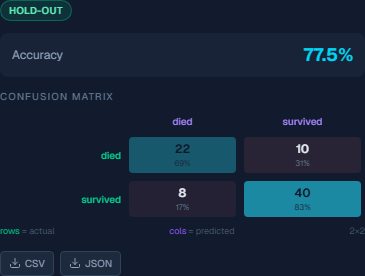
Hold-out confusion matrix for Titanic survival. True died 22, predicted survived 10, predicted died 8, true survived 40.
Confusion matrix
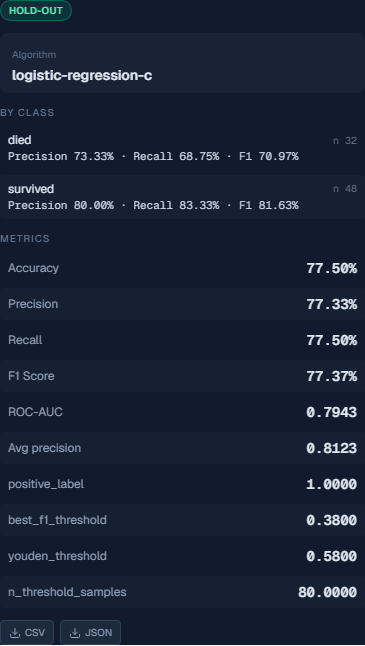
Hold-out metrics for Titanic survival. Accuracy 77.50 percent. Survived precision 80.00 percent, recall 83.33 percent, F1 81.63 percent. ROC-AUC 0.7943. Average precision 0.8123.
Metrics
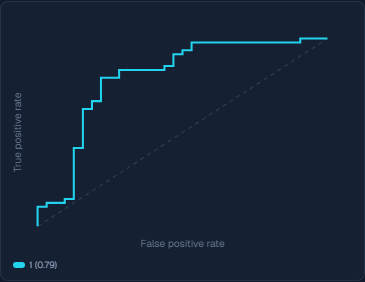
ROC curve for the Titanic hold-out. ROC-AUC 0.7943.
ROC
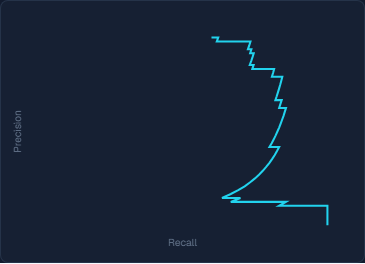
Precision-recall curve for the Titanic hold-out. Average precision 0.8123.
Precision–recall

Published run

Logistic regression with C 1.0 and the lbfgs solver, seed 42, test size 0.2, stratified. Survived is the answer. Hold-out 80 of 400. Accuracy 77.50 percent. For the passengers who survived, precision 80.00 percent, recall 83.33 percent, F1 81.63 percent, on 48 rows. ROC-AUC 0.7943. Average precision 0.8123. Of the 32 who died, 22 were predicted died and 10 were predicted survived. Of the 48 who survived, 40 were predicted survived and 8 were predicted died. The Titanic survival graph opens this run.