Published run
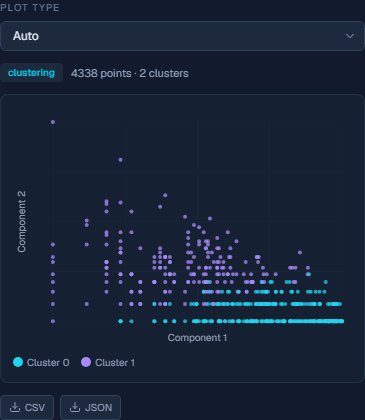
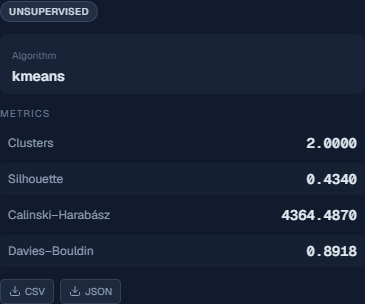
The download is the invoice file. The canvas loads a customer table built from it: lines with a customer id, a positive quantity, and a positive price, after cancellations are dropped. That leaves 397,884 lines and 4,338 customers. Recency is days from each customer's last invoice to 2011-12-10, the day after the last invoice in the file (2011-12-09). Frequency is the number of distinct invoices. Monetary value is the sum of quantity times price. The customer id is the grouping key and is not a feature. Country stays out. Power transform uses log. Normalization uses the standard scale. K-Means uses k=2, the silhouette peak for k from 2 through 8, seed 42. Silhouette 0.4340. Calinski-Harabasz 4364.4870. Davies-Bouldin 0.8918. The groups hold 2,682 and 1,656 customers. scikit-learn 1.4.2, computed on 2026-11-04. The Online Retail blueprint opens this graph and plays the same run. The voice says silhouette 0.4340, Calinski-Harabasz 4364.4870, and Davies-Bouldin 0.8918. Silhouette is positive and well short of 1. Davies-Bouldin is below 1. k of 2 is the peak of that check, and it is a candidate, not proof of two segments.