
Columns
| Column | What it holds |
|---|---|
| Age | Numeric measurement. |
| Annual Income (k$) | Numeric measurement, k$. |
| Spending Score (1-100) | Numeric measurement, 1-100. |
200 shoppers with age, annual income, and spending score. A small tutorial table for segmentation, not a scale benchmark.
200 rows and 3 numeric columns. Creator: Mall customer segmentation tutorial. License: Tutorial table hosted on this site. A 200-row tutorial table of shoppers, not a scale proof. The fit uses age, annual income, and spending score.
| Column | What it holds |
|---|---|
| Age | Numeric measurement. |
| Annual Income (k$) | Numeric measurement, k$. |
| Spending Score (1-100) | Numeric measurement, 1-100. |
Copilot sets k to five on this Mall Customers graph.
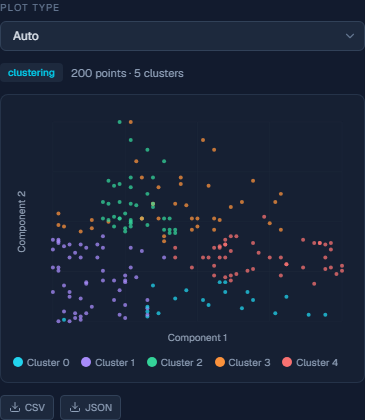
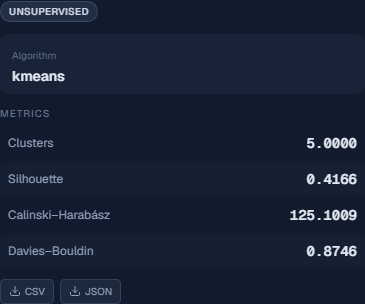
K-Means with k=5, seed 42, StandardScaler, scikit-learn 1.4.2. Computed on 2026-11-04. 200 rows, 5 clusters. Silhouette 0.416643. Calinski-Harabasz 125.10094. Davies-Bouldin 0.874551. The customer segmentation blueprint opens this graph and plays the same run. The voice says silhouette 0.4166, Calinski-Harabasz 125.1009, and Davies-Bouldin 0.8746. Silhouette is positive and well short of 1. Davies-Bouldin is below 1. k of 5 is a starting split, not a searched peak.